March 26, 2026
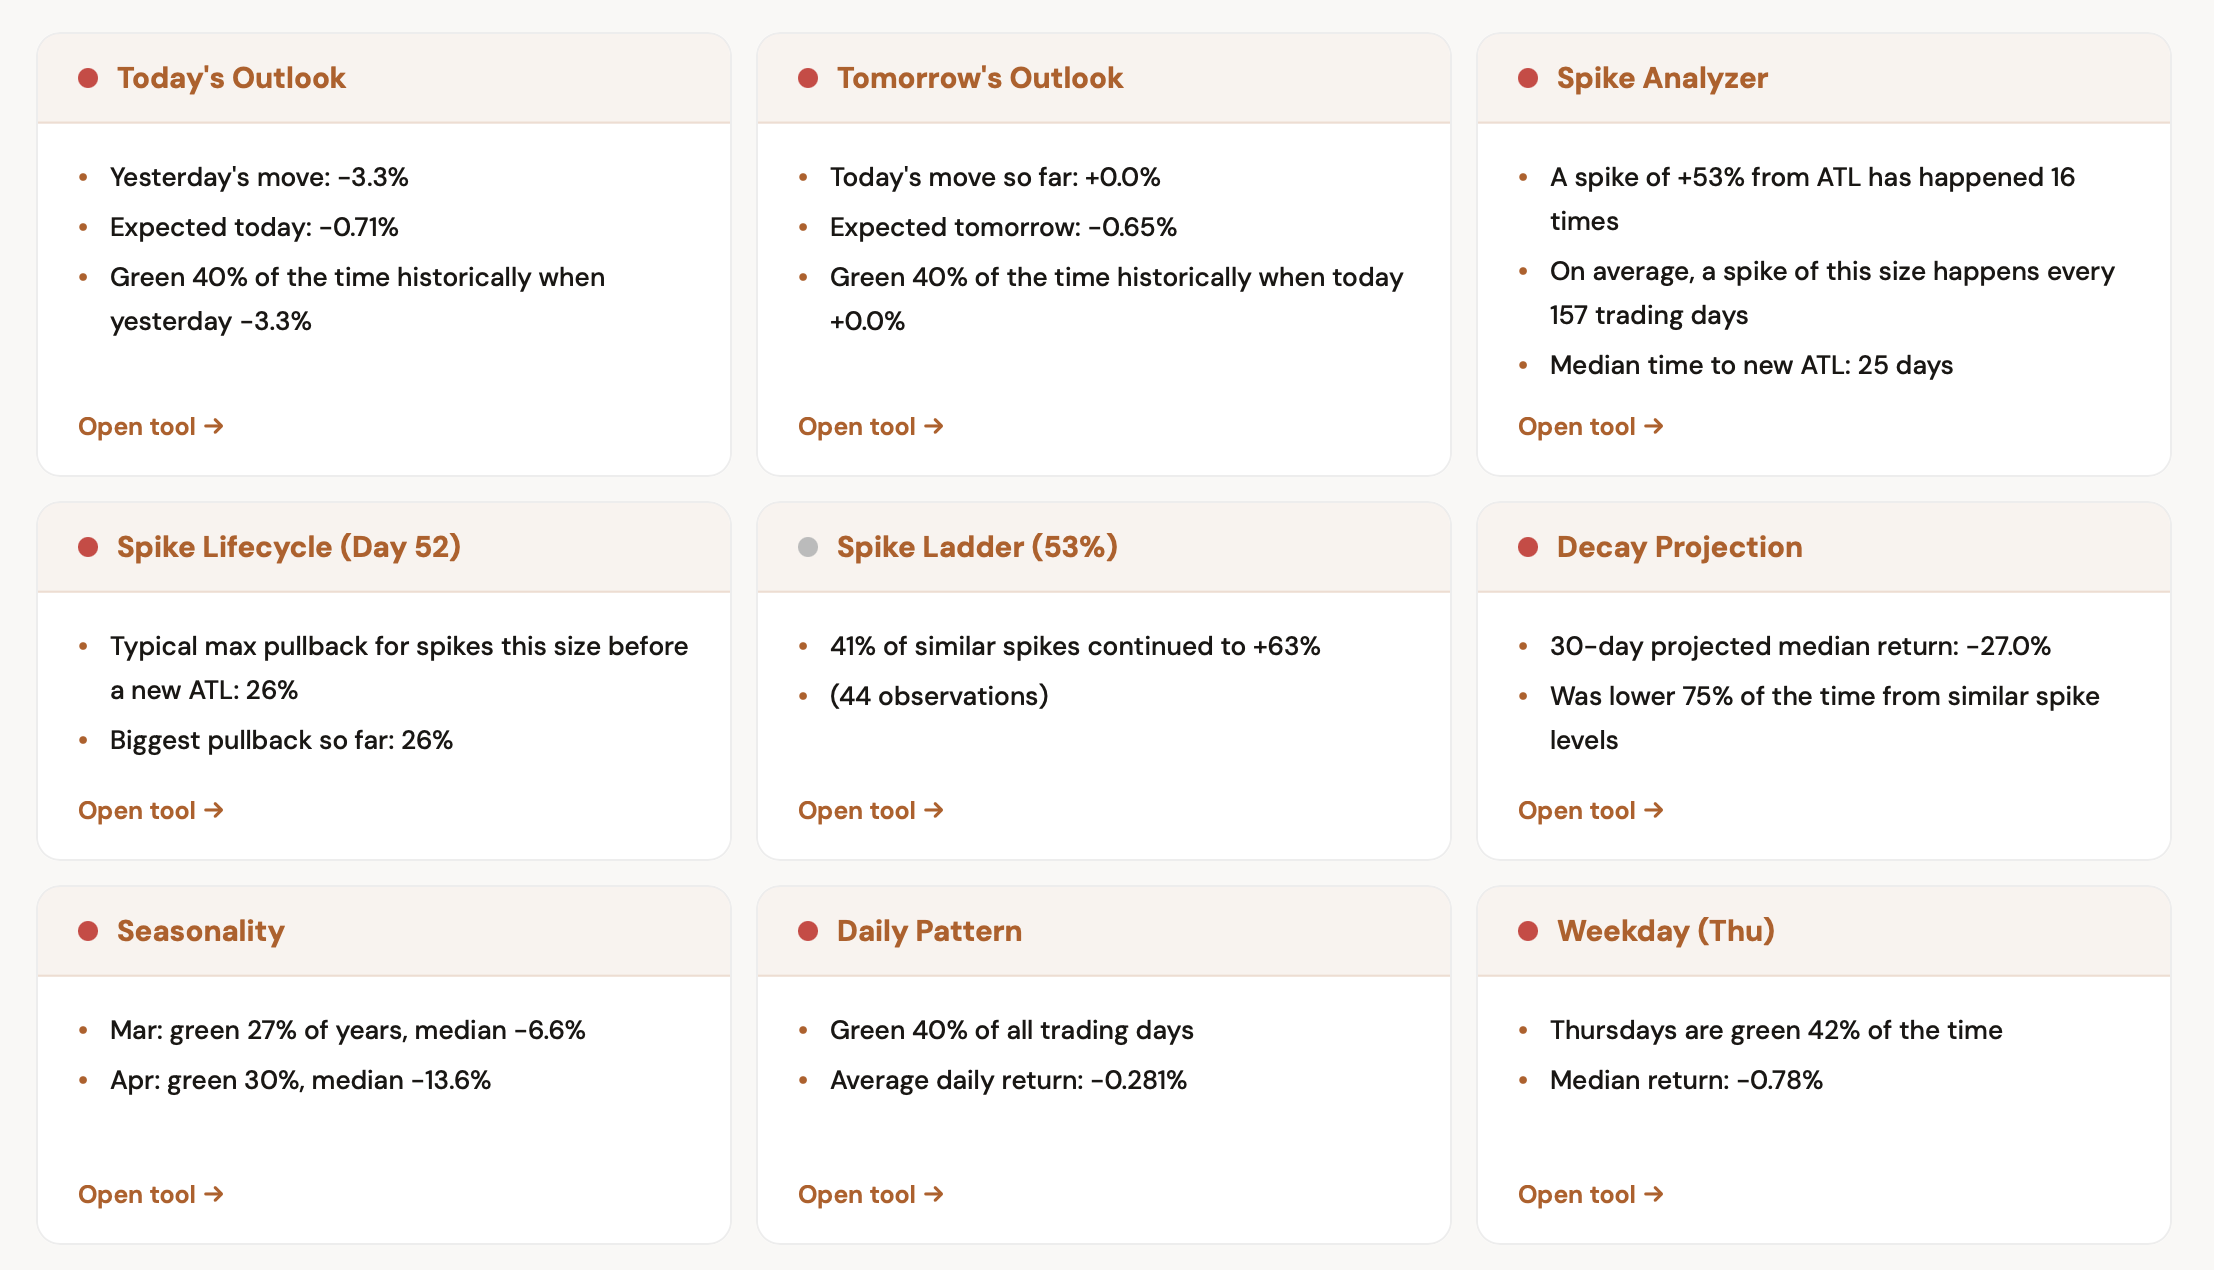
Introducing X-Ray: Run Every Tool on One Ticker Instantly
Select a ticker and every tool runs at once. The results appear on a single page, organized into clear signal cards.
Read more
March 25, 2026
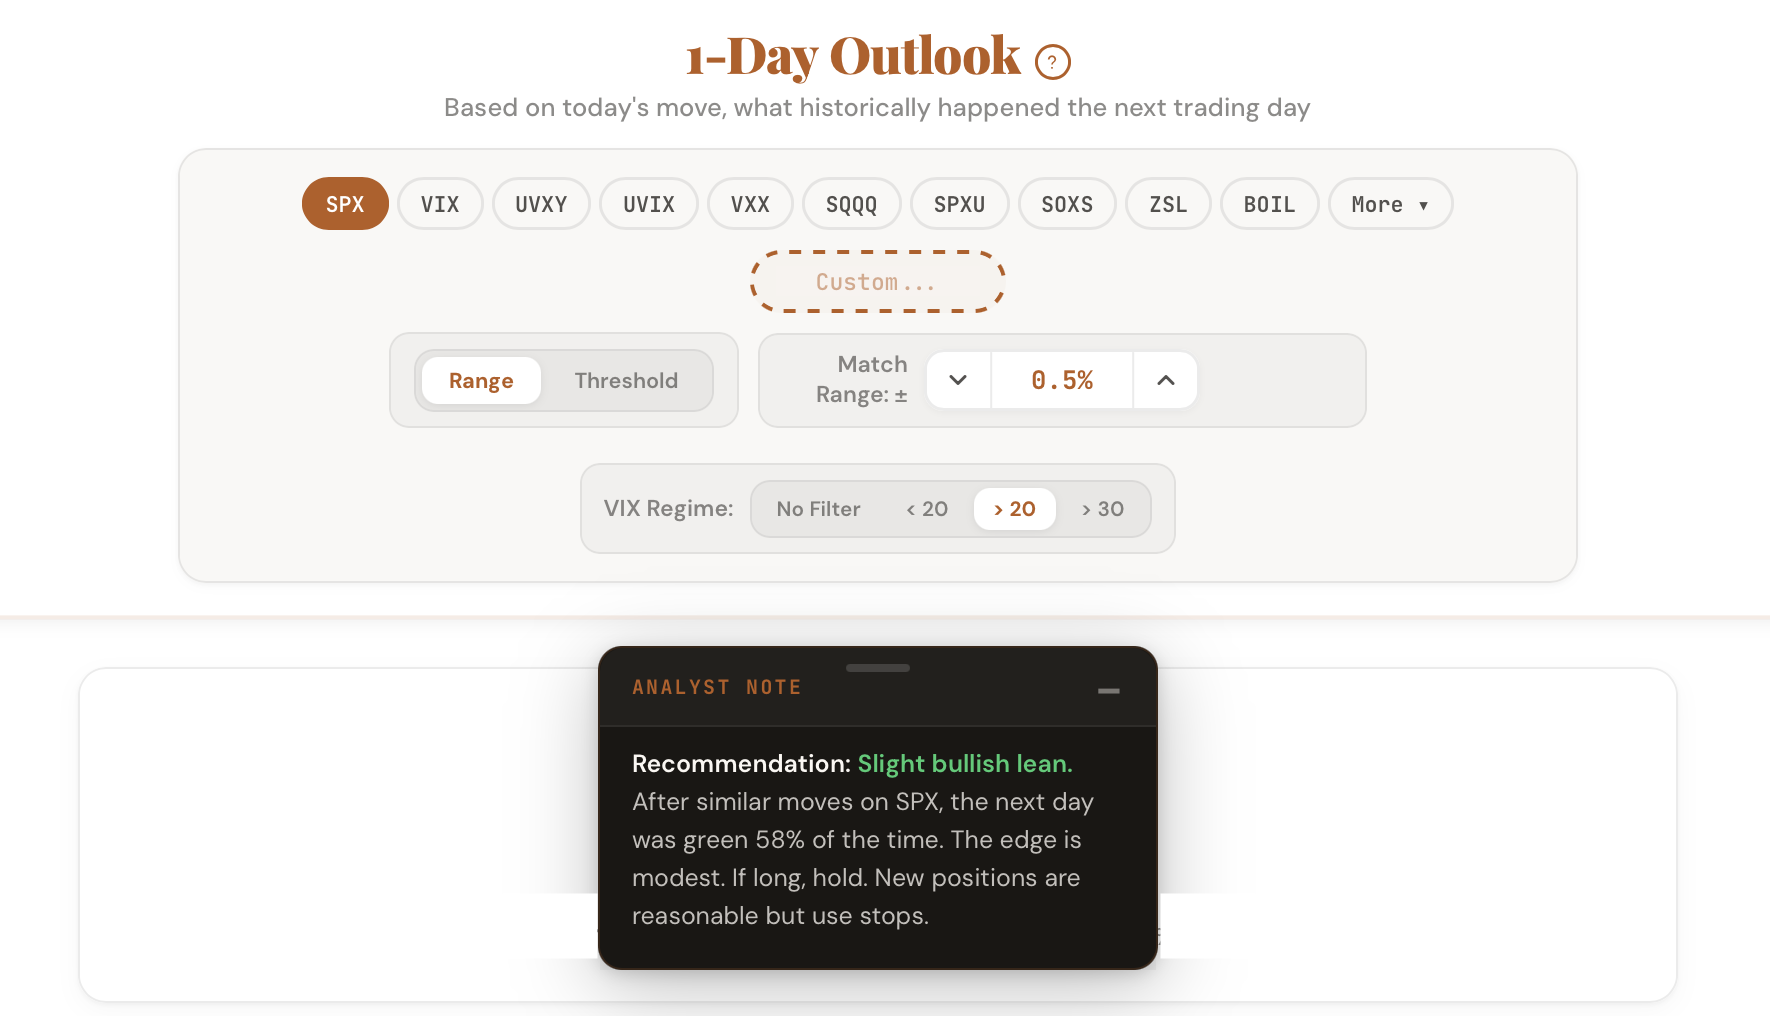
Every Tool Now Comes with an Analyst Note
Every CI Volatility tool now includes a built-in Analyst Note that reads the data on screen and gives you a plain-English recommendation.
Read more
March 24, 2026
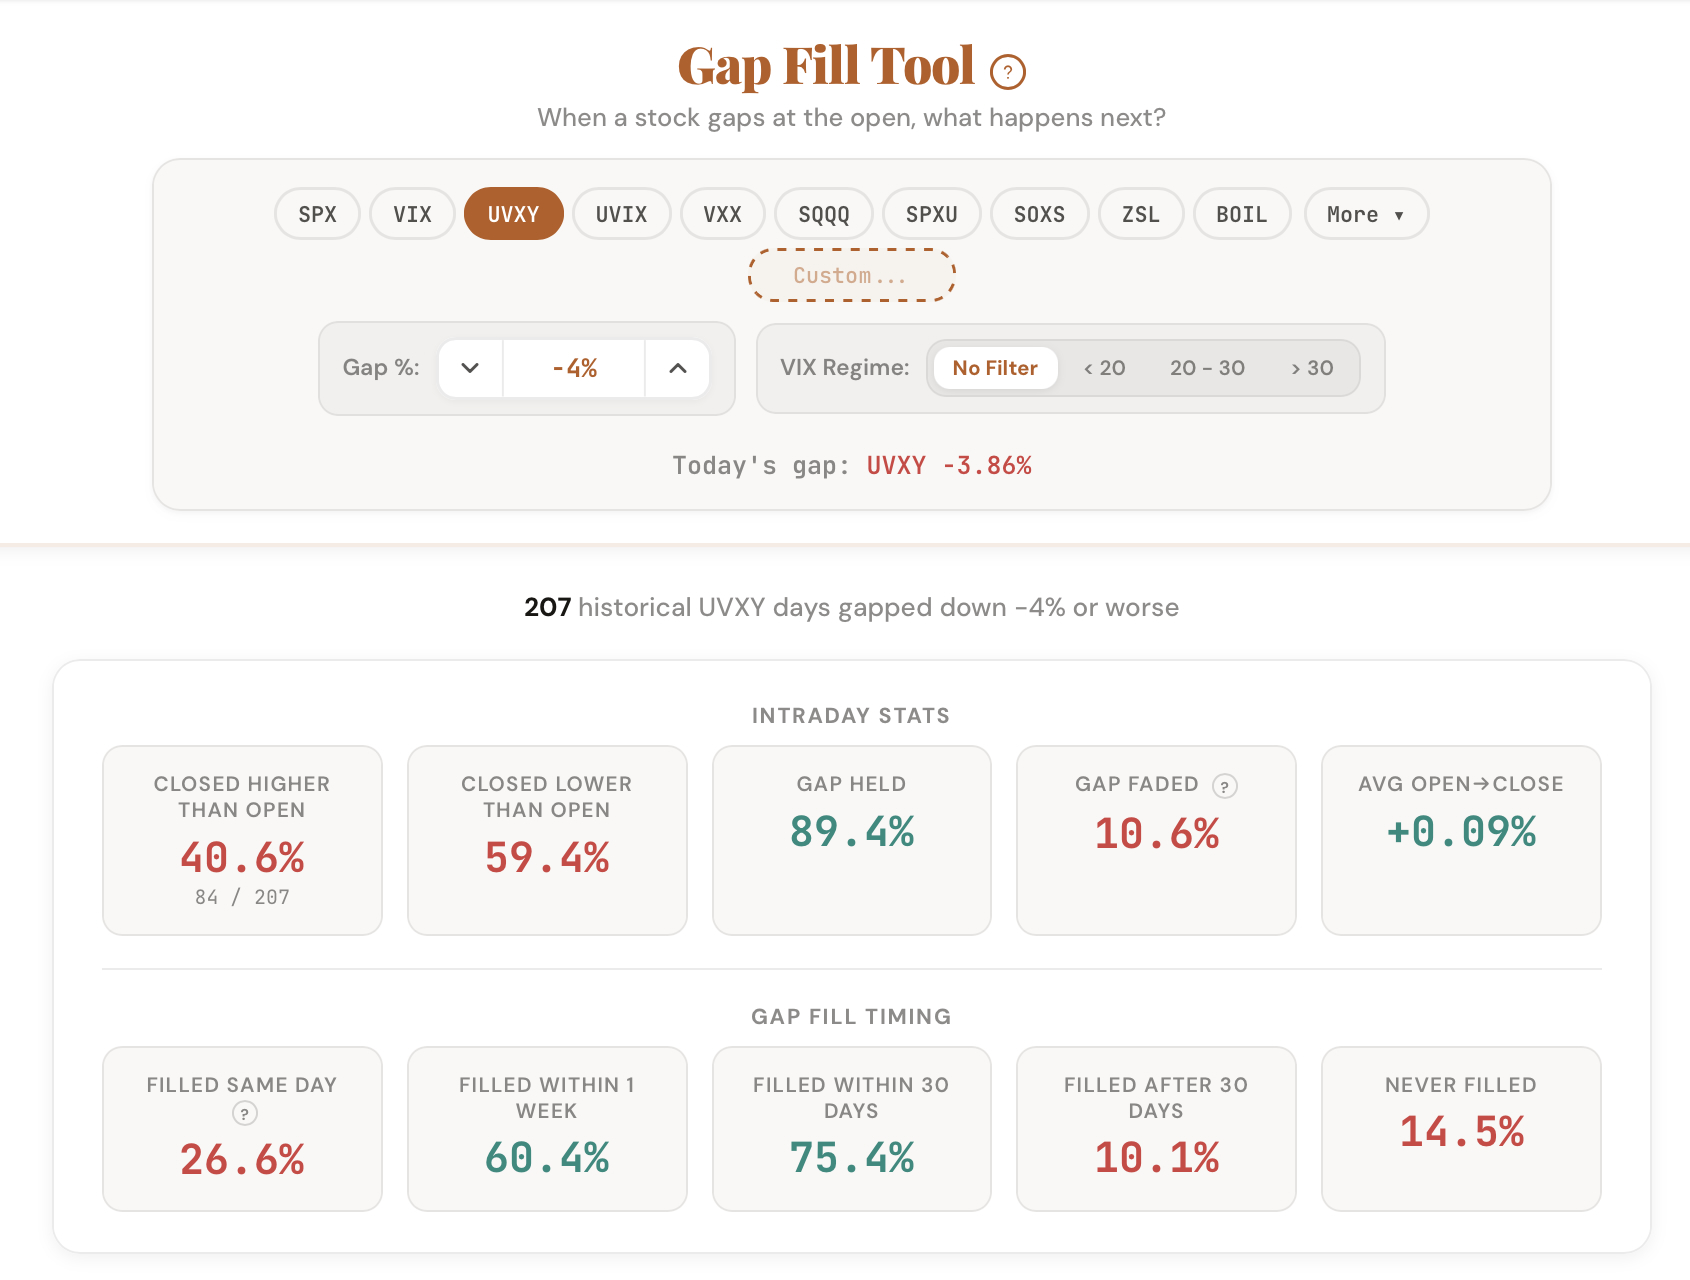
When a Stock Gaps Up or Down at the Open, How Often Does It Actually Fill?
We just launched the Gap Fill Tool, a new addition to the CI Volatility suite that answers this question with real data.
Read more
March 23, 2026
Based on Today's Move, What Historically Happened the Next Trading Day?
We just launched the 1-Day Outlook tool. Enter any ticker and see what historically happened the next trading day.
Read more
March 5, 2026
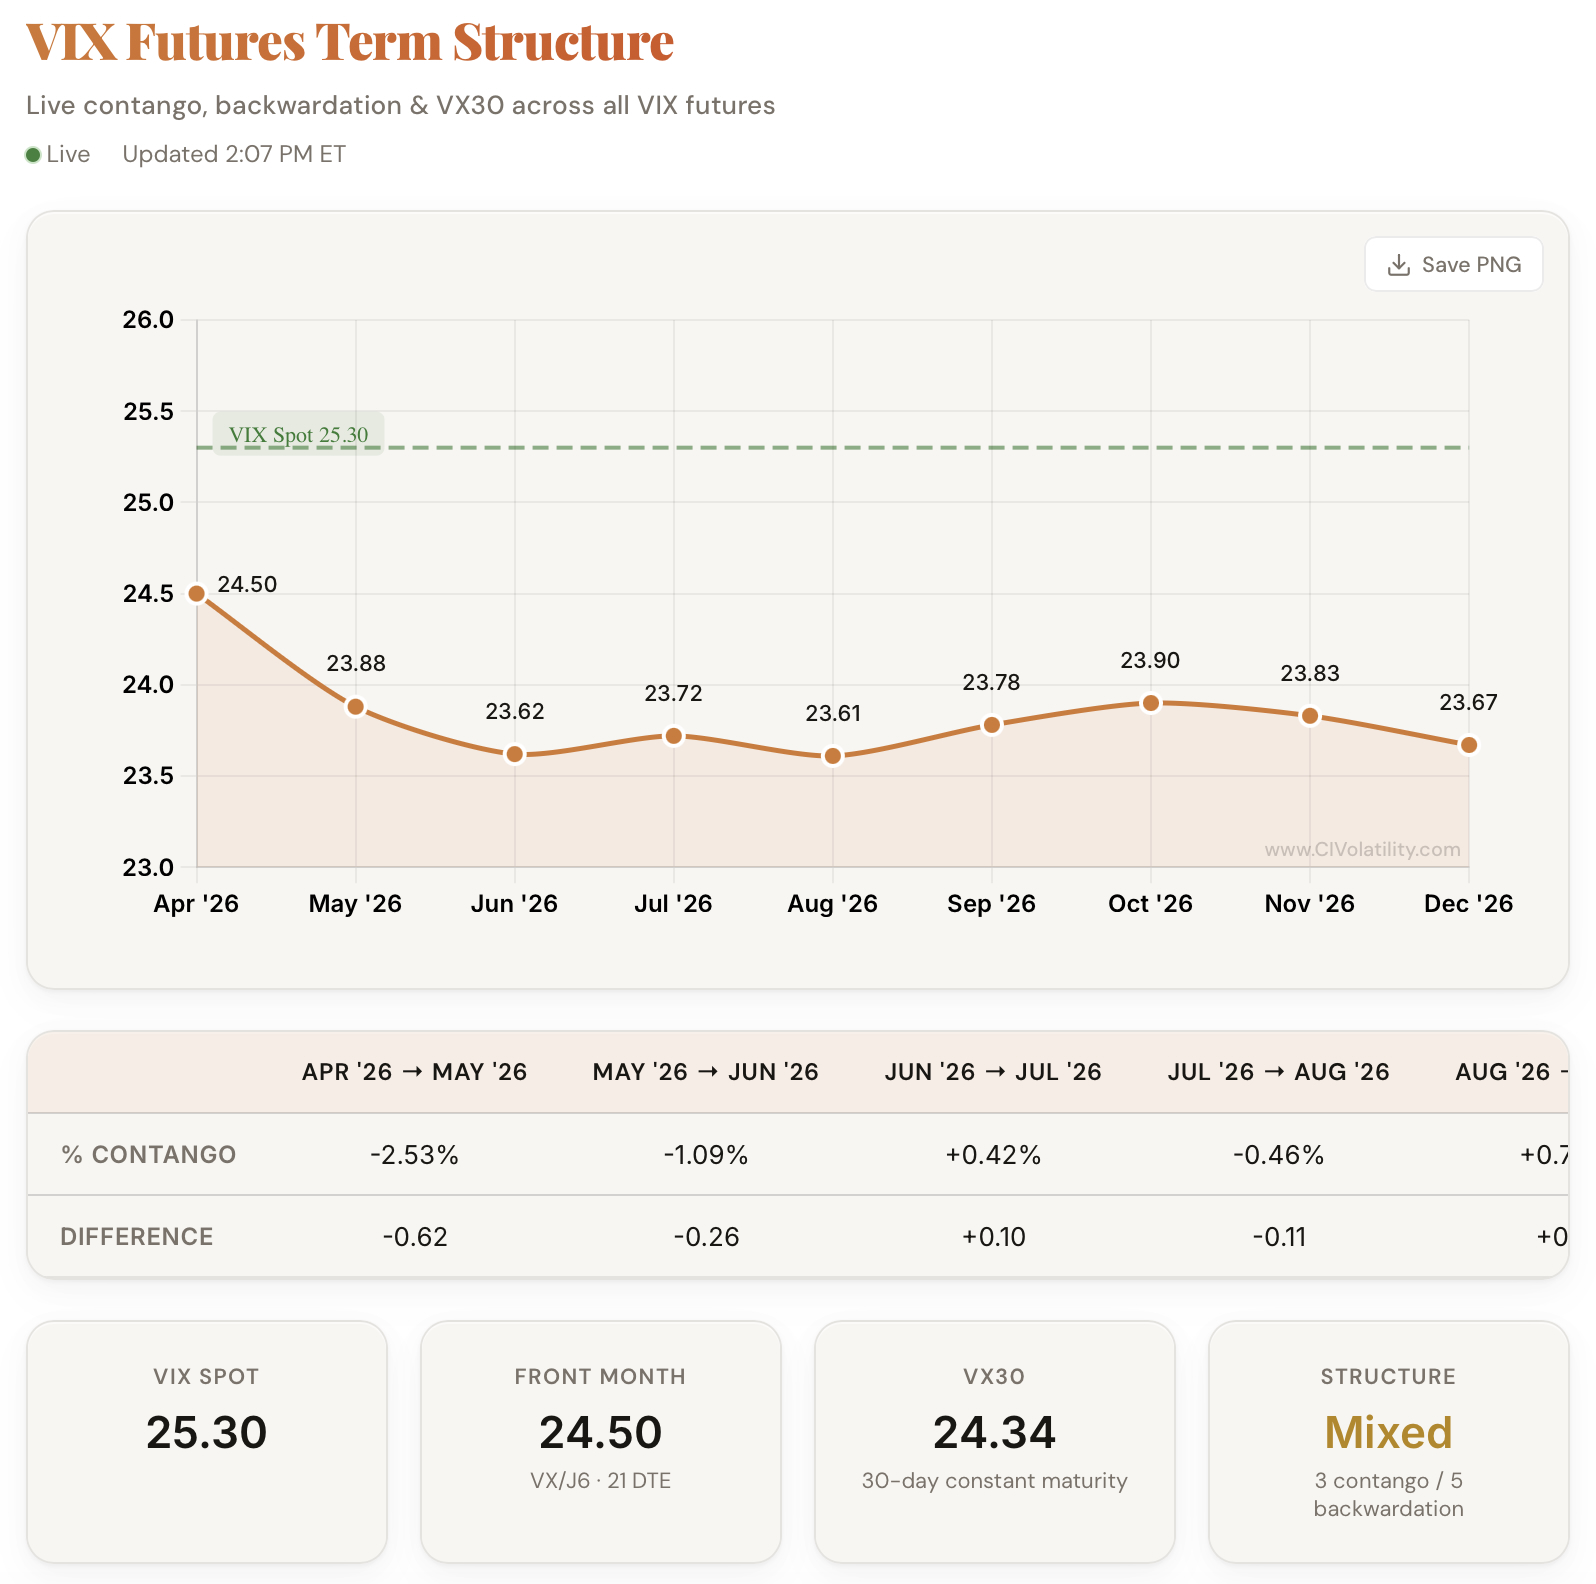
Introducing the CI Volatility VIX Term Structure Tool
The shape of the VIX futures curve is one of the most important signals in volatility trading. Now you can see it in real time.
Read more
February 24, 2026
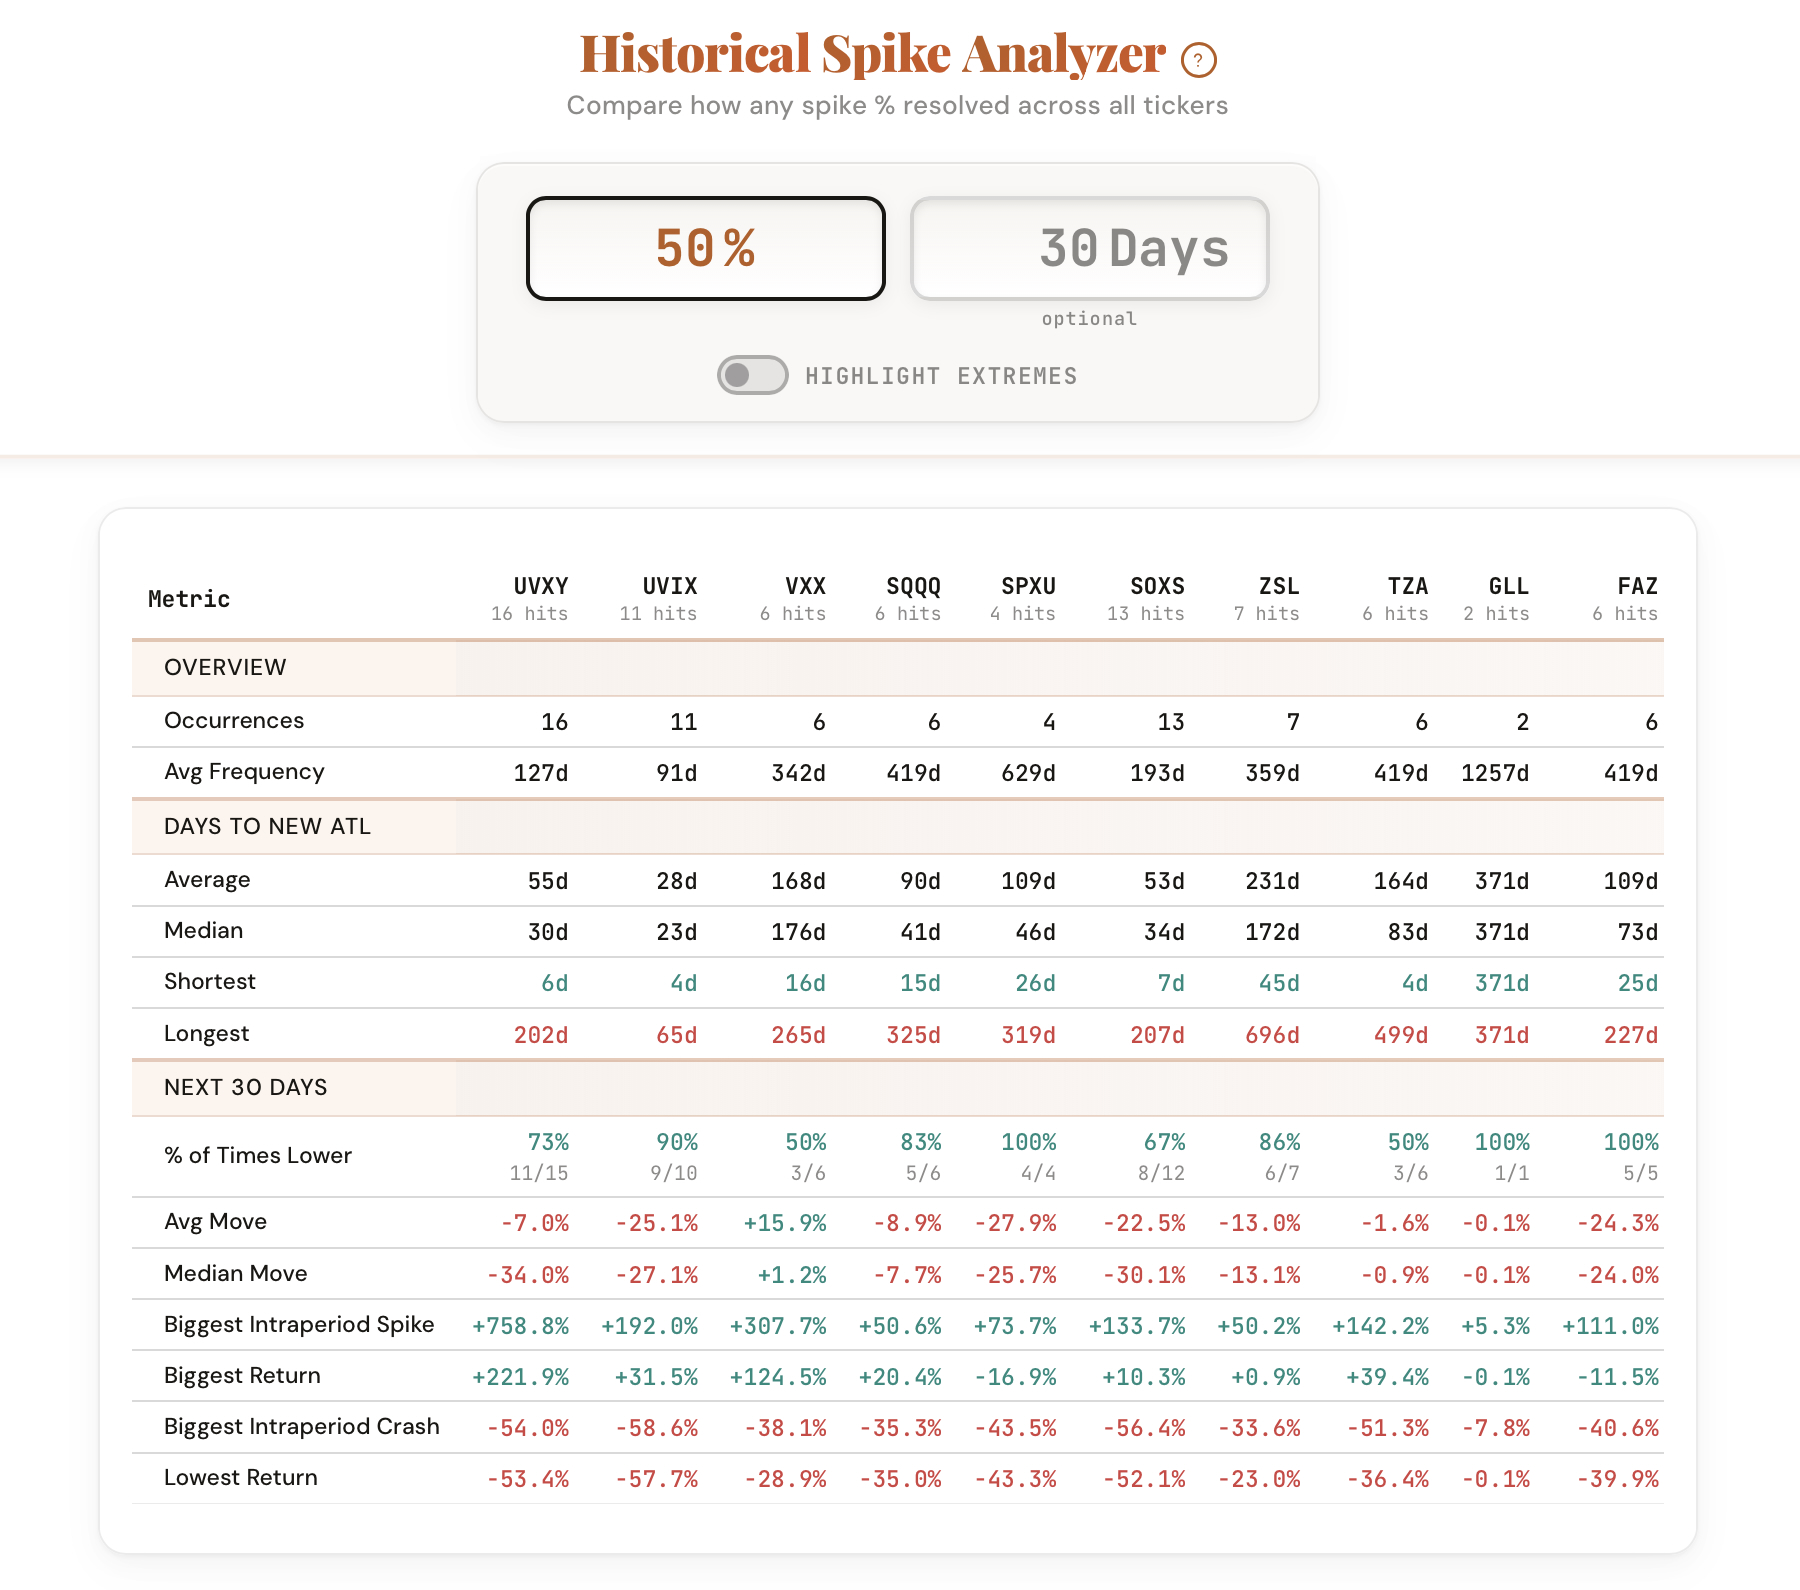
Your Stock Just Spiked 50%. What Happens Next?
We just launched the Spike Analyzer. Enter any spike percentage and compare how it resolved across every ticker.
Read more
February 21, 2026
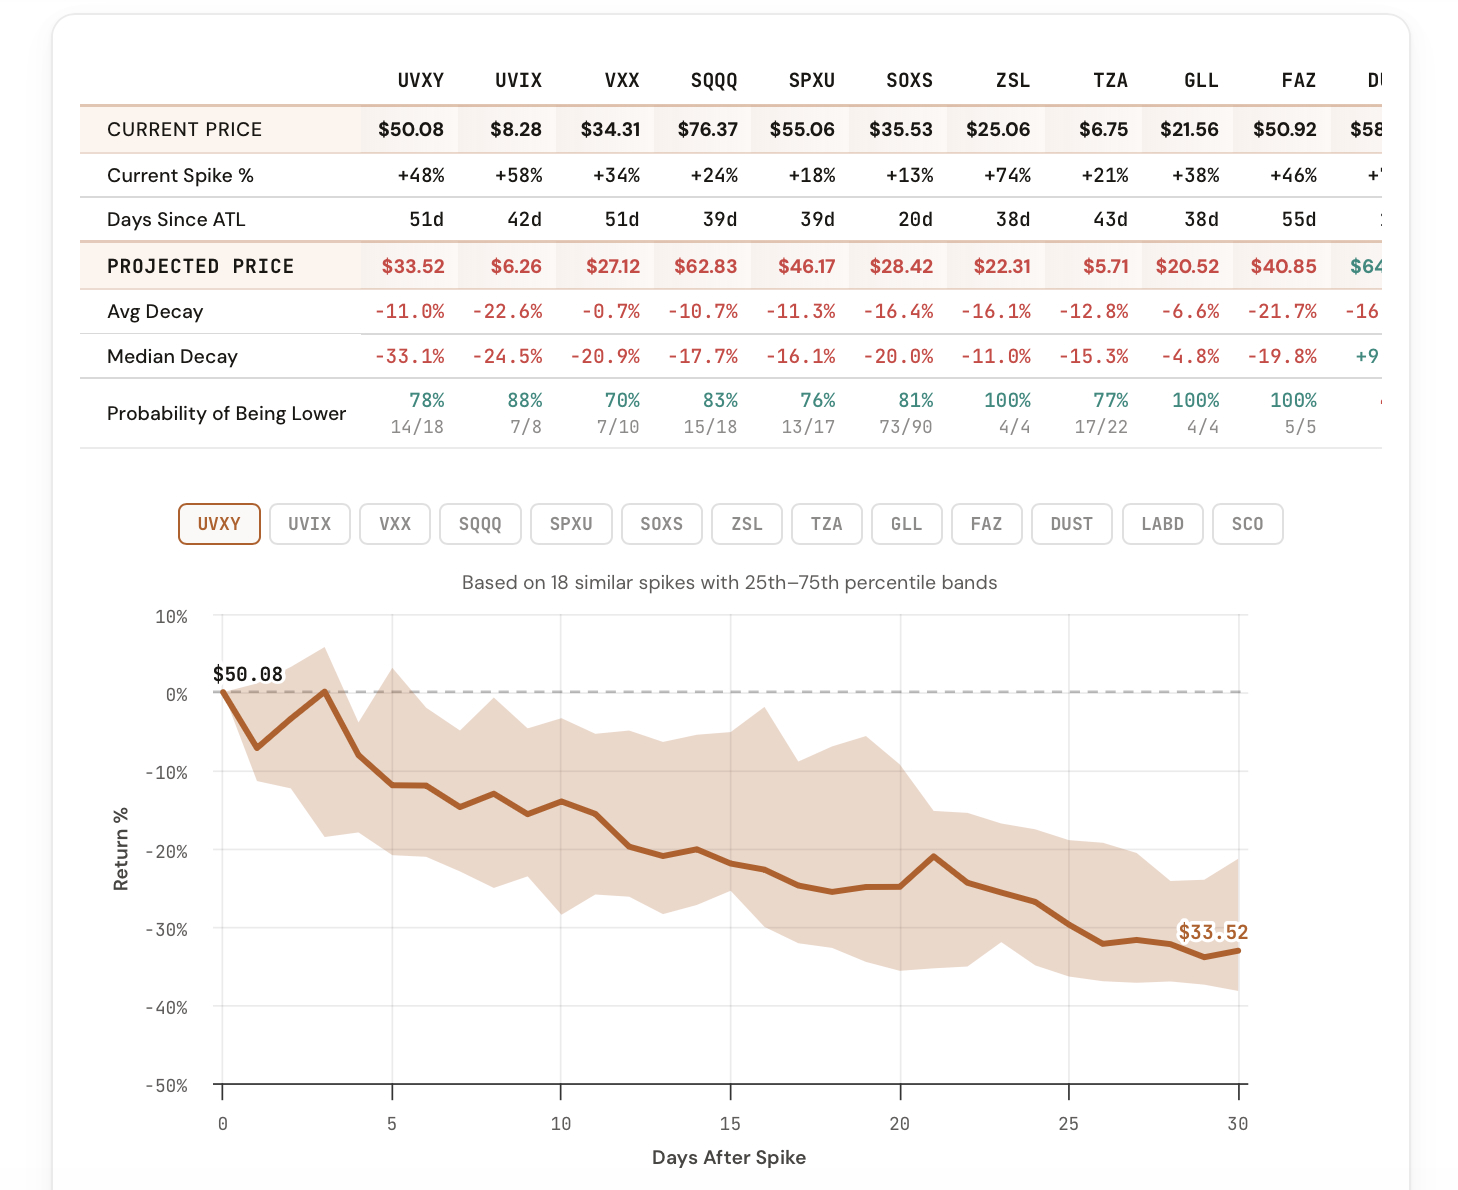
How Much Will Your Leveraged ETF Decay in 30 Days? Now You Can See It
Enter a number of days and instantly see projected decay for every leveraged and inverse ETF.
Read more
February 19, 2026
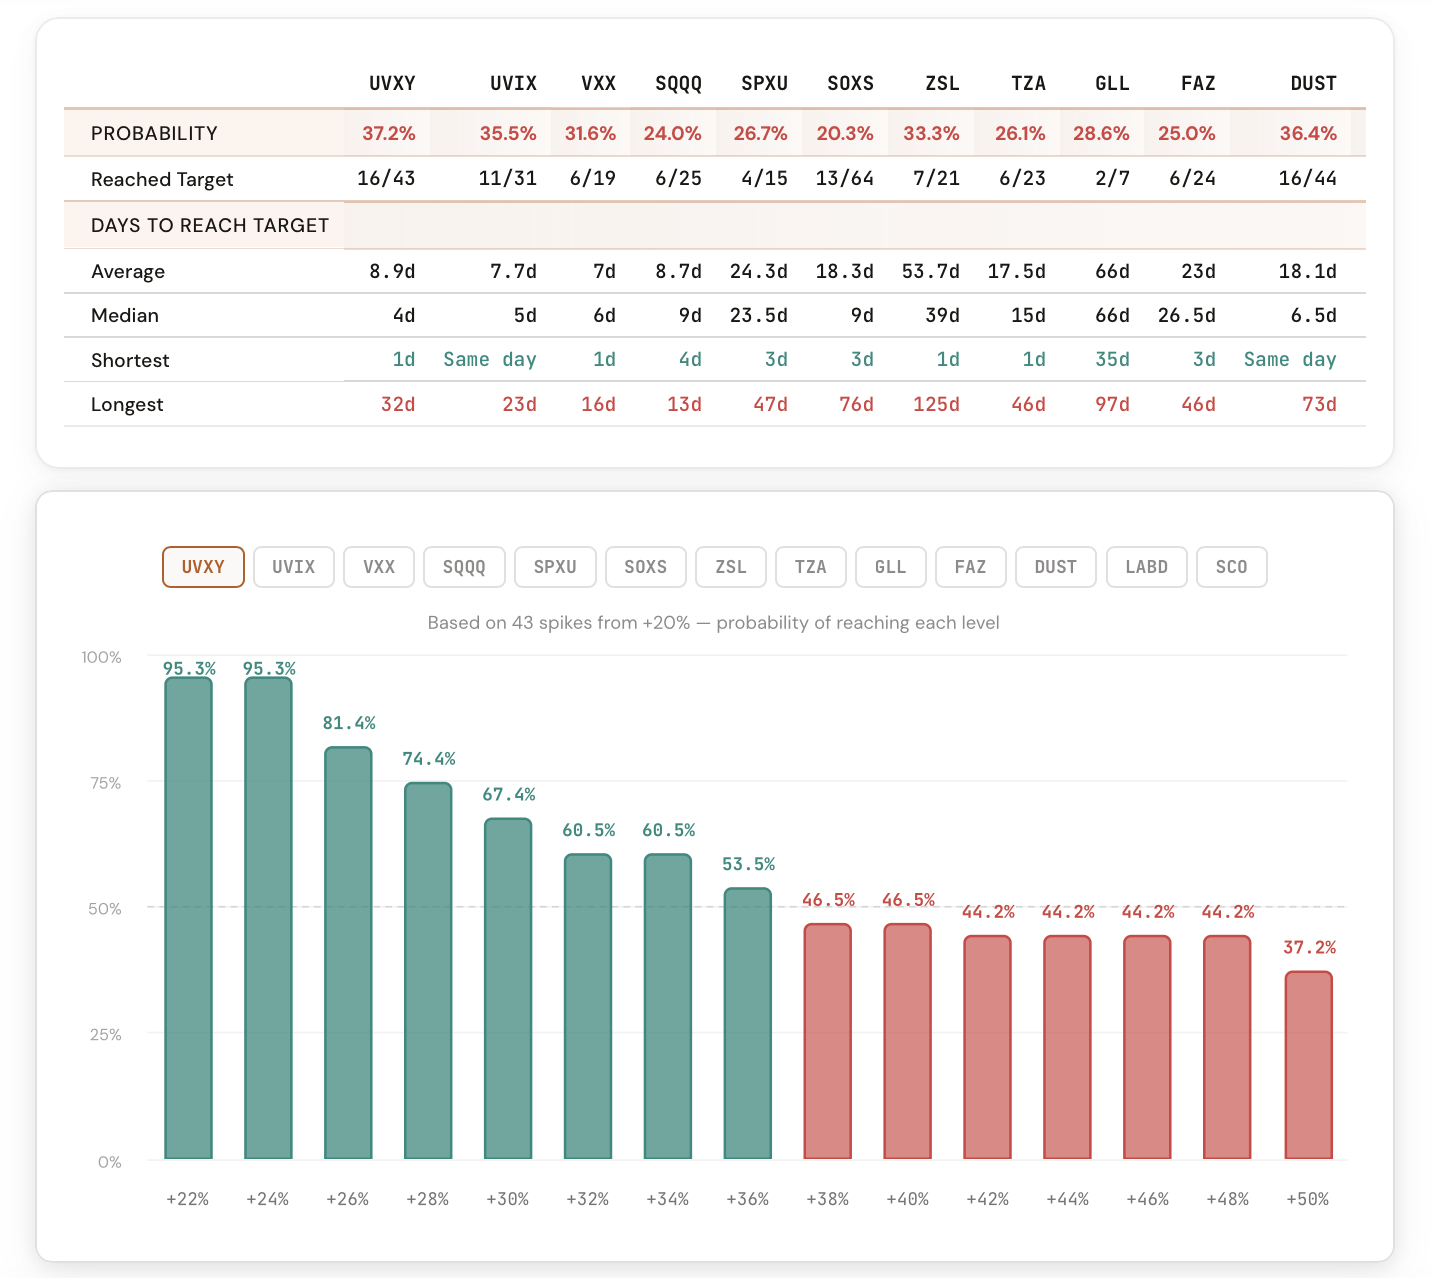
If a Stock Spikes 10%, What Are the Odds It Reaches 50%?
Enter any two spike levels and see the historical probability of continuation across every ticker.
Read more
February 15, 2026
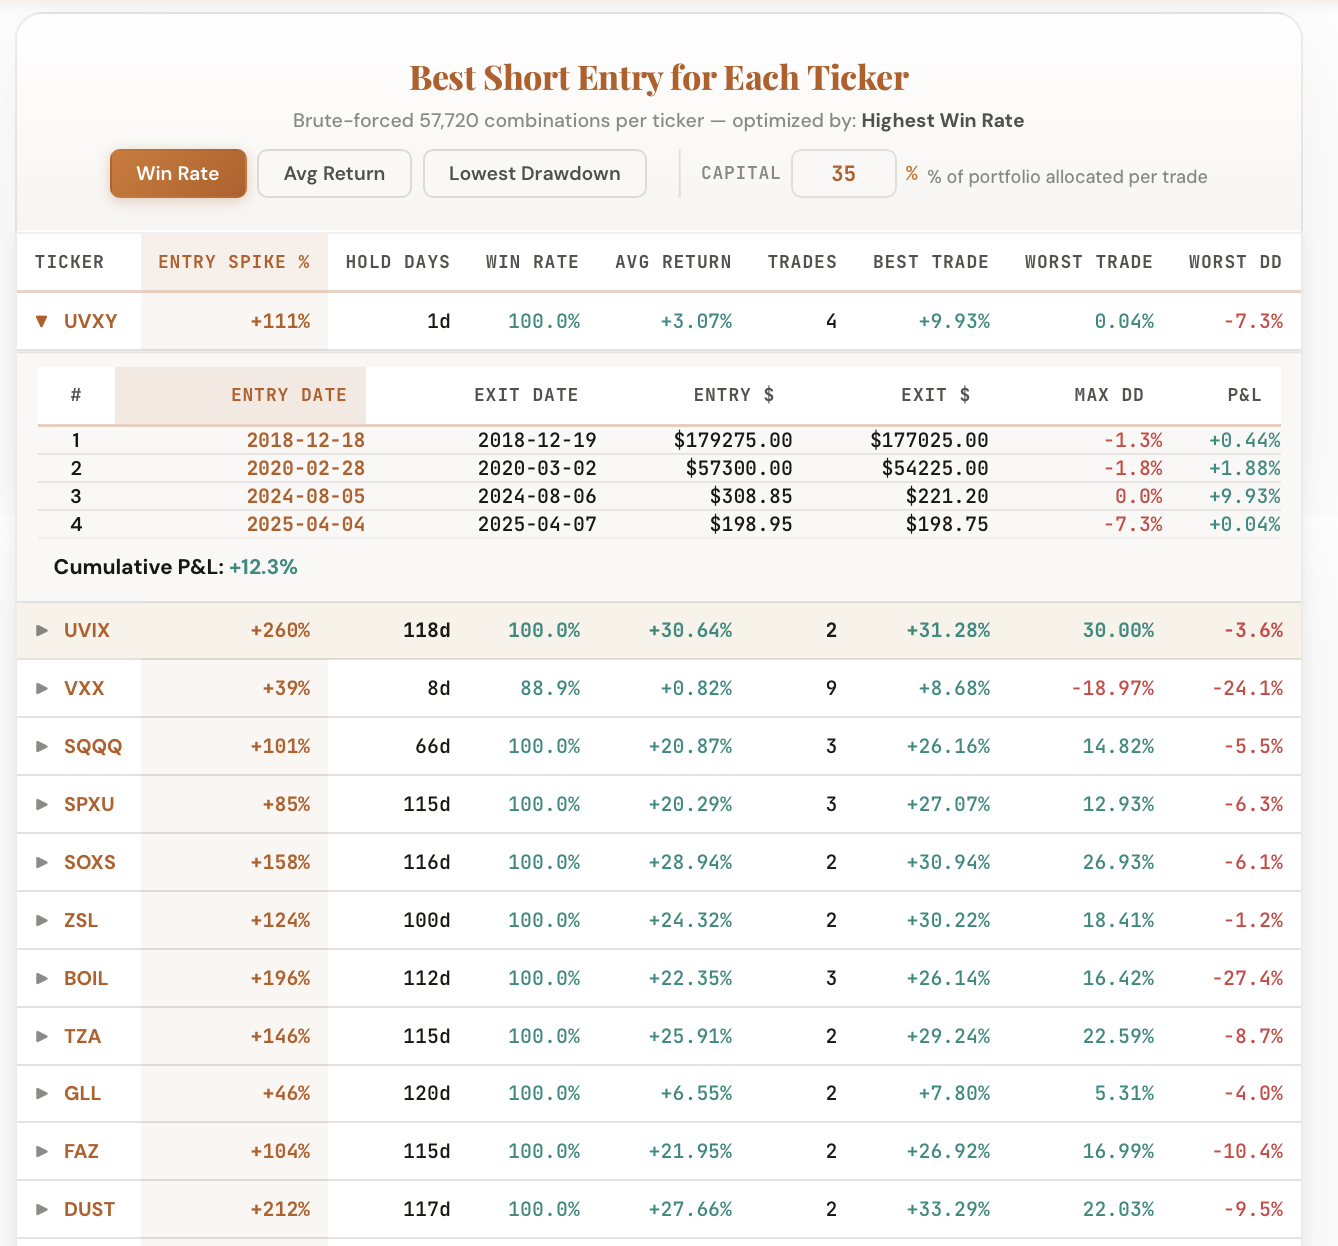
We Brute-Forced 57,720 Spike Trading Combinations. Here Are the Best Ones
It tests every possible entry and exit combination to find the optimal spike trade for each ticker.
Read more
February 12, 2026
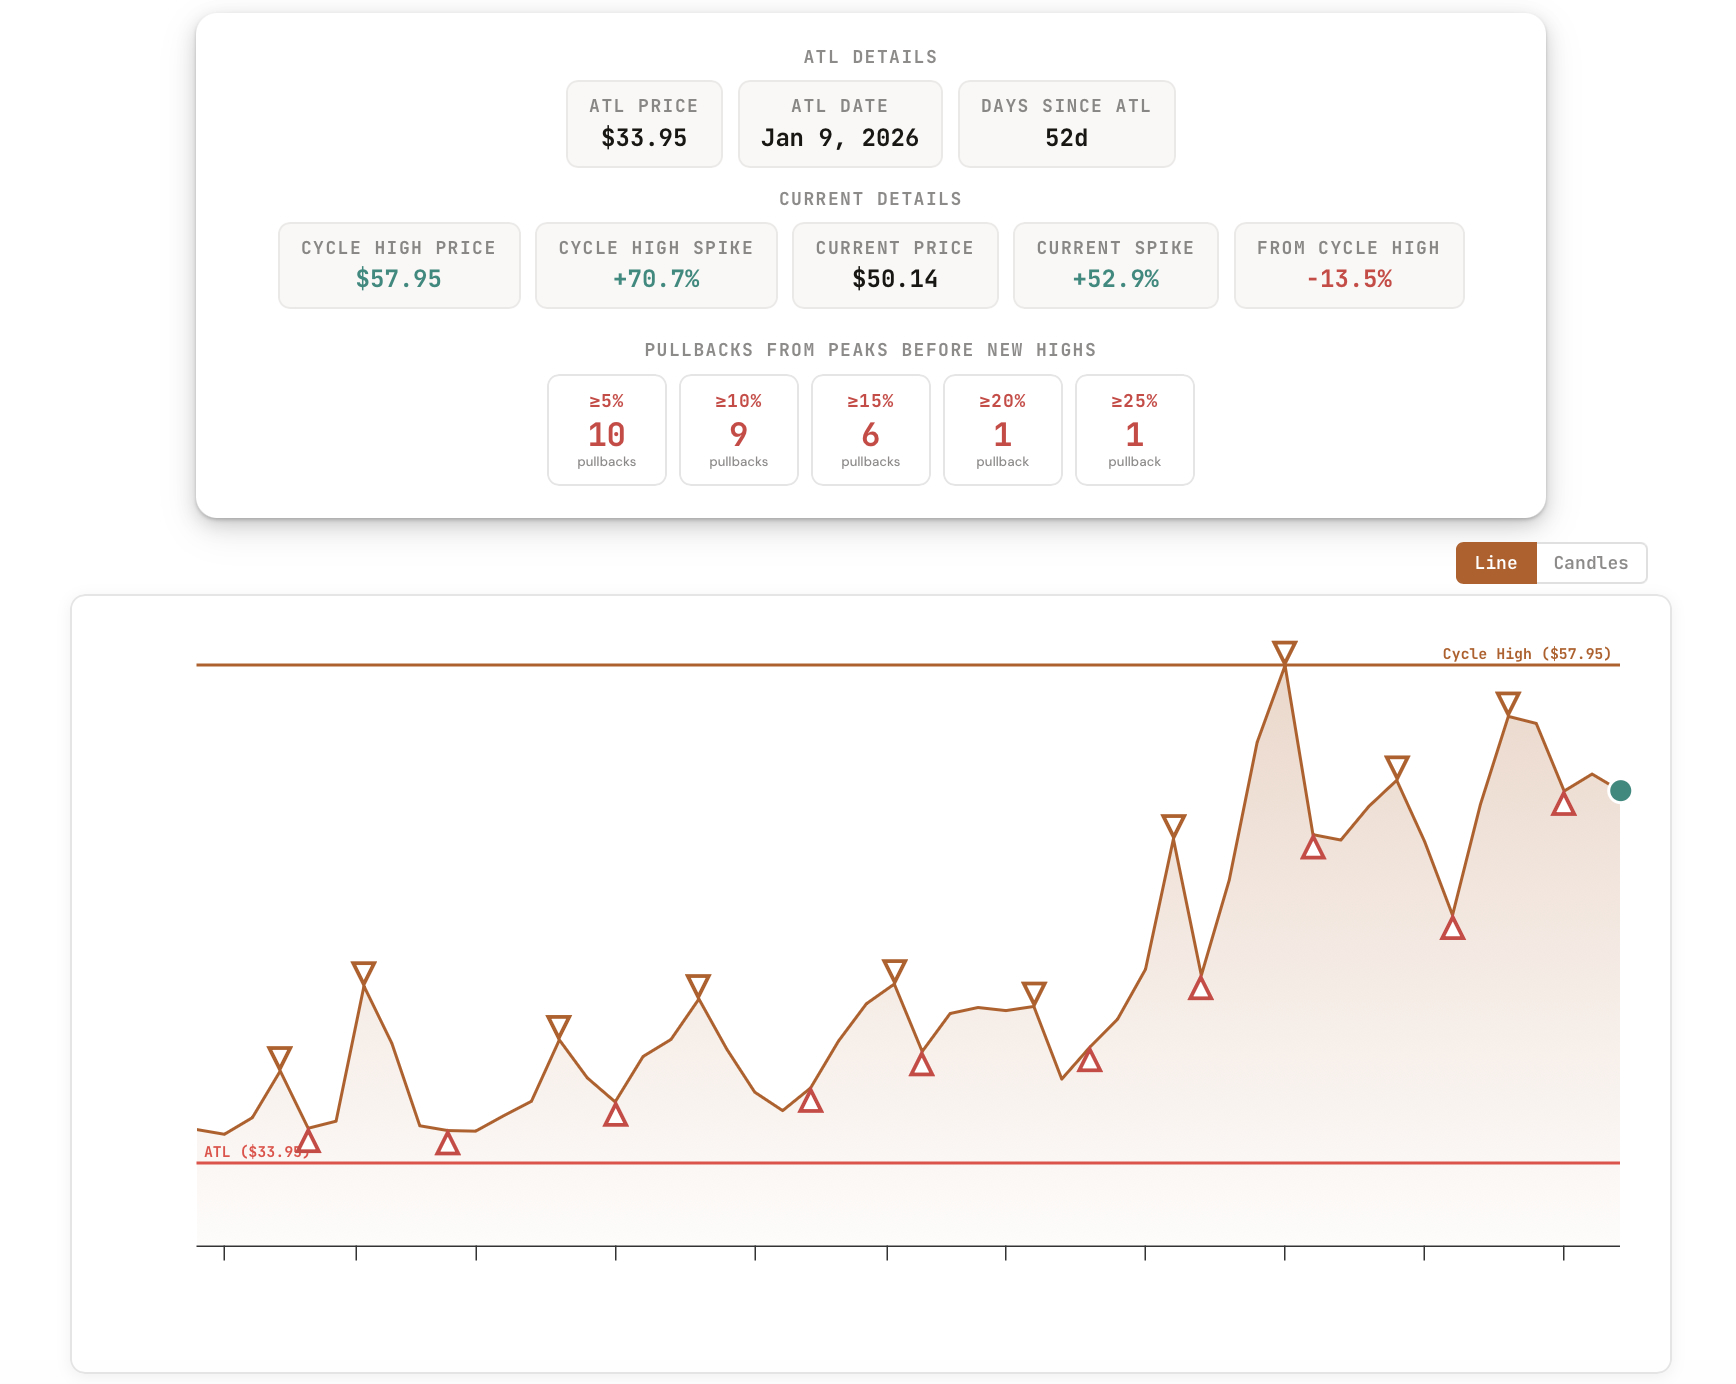
Track Every Spike From Start to Finish With the Spike Lifecycle Tool
See the current cycle from all-time low to present, with peaks, pullbacks, and historical context.
Read more
January 8, 2026
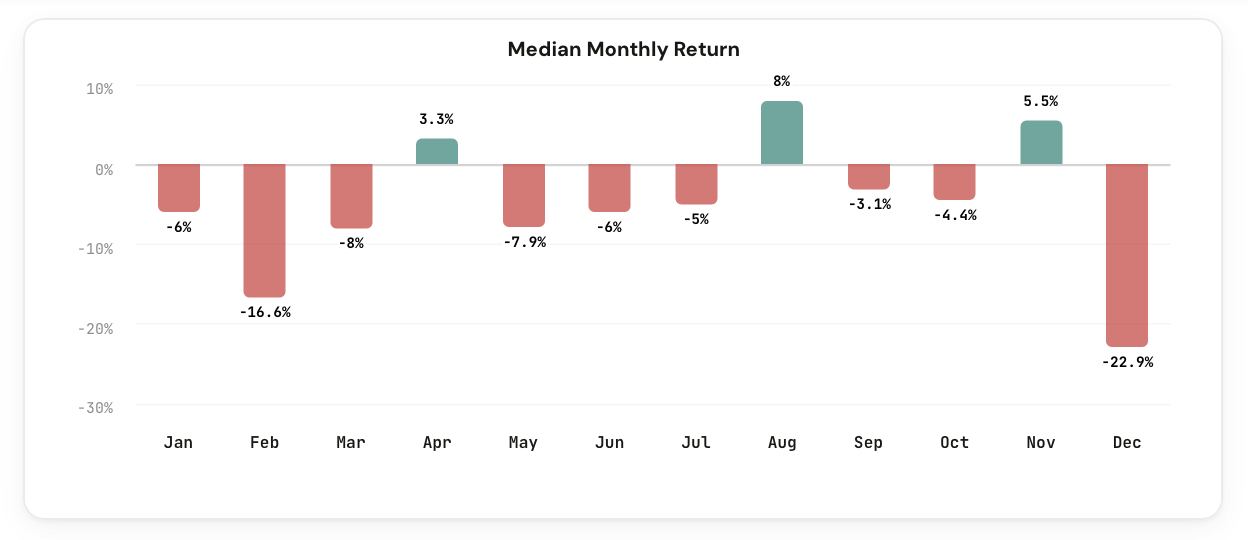
Which Months Are Best (and Worst) for Leveraged ETFs? The Data Might Surprise You
Monthly return patterns and seasonal trends for every volatility product, backed by years of data.
Read more
January 5, 2026
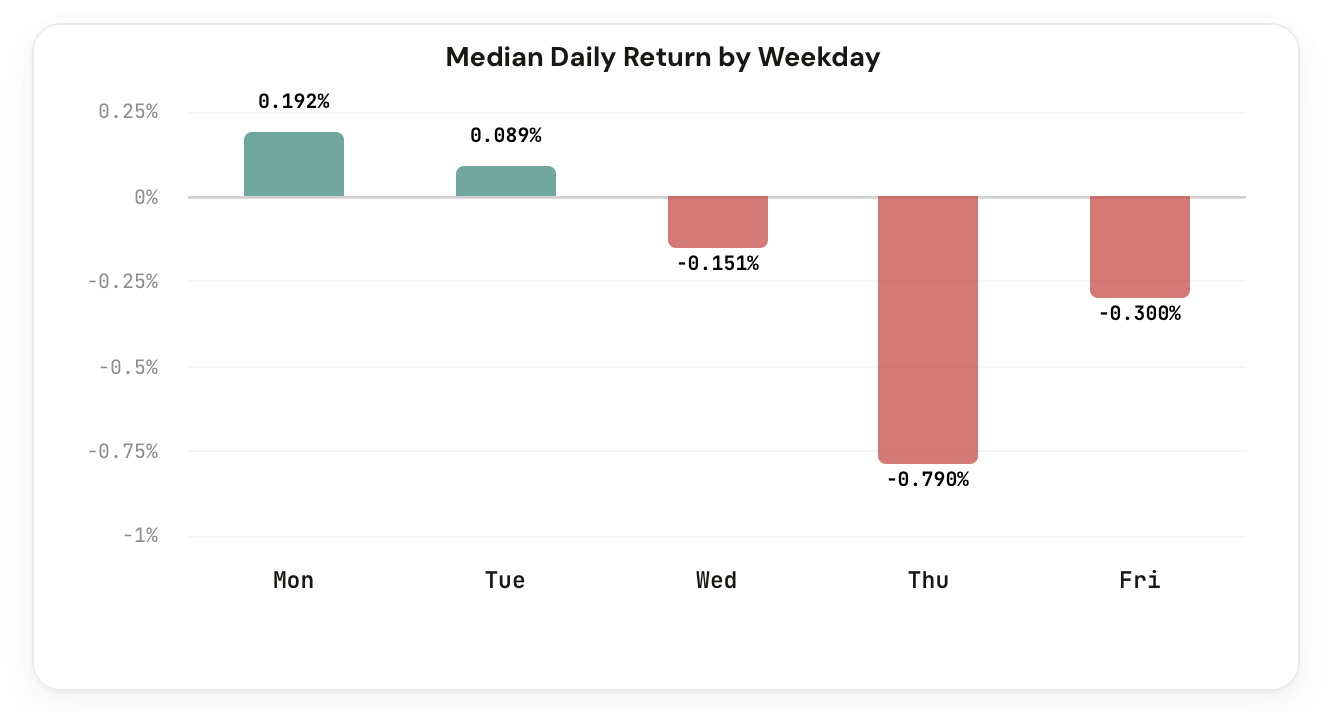
Does It Matter Which Day of the Week You Trade Leveraged ETFs?
Day-of-week return patterns for every leveraged and inverse ETF, backed by years of data.
Read more
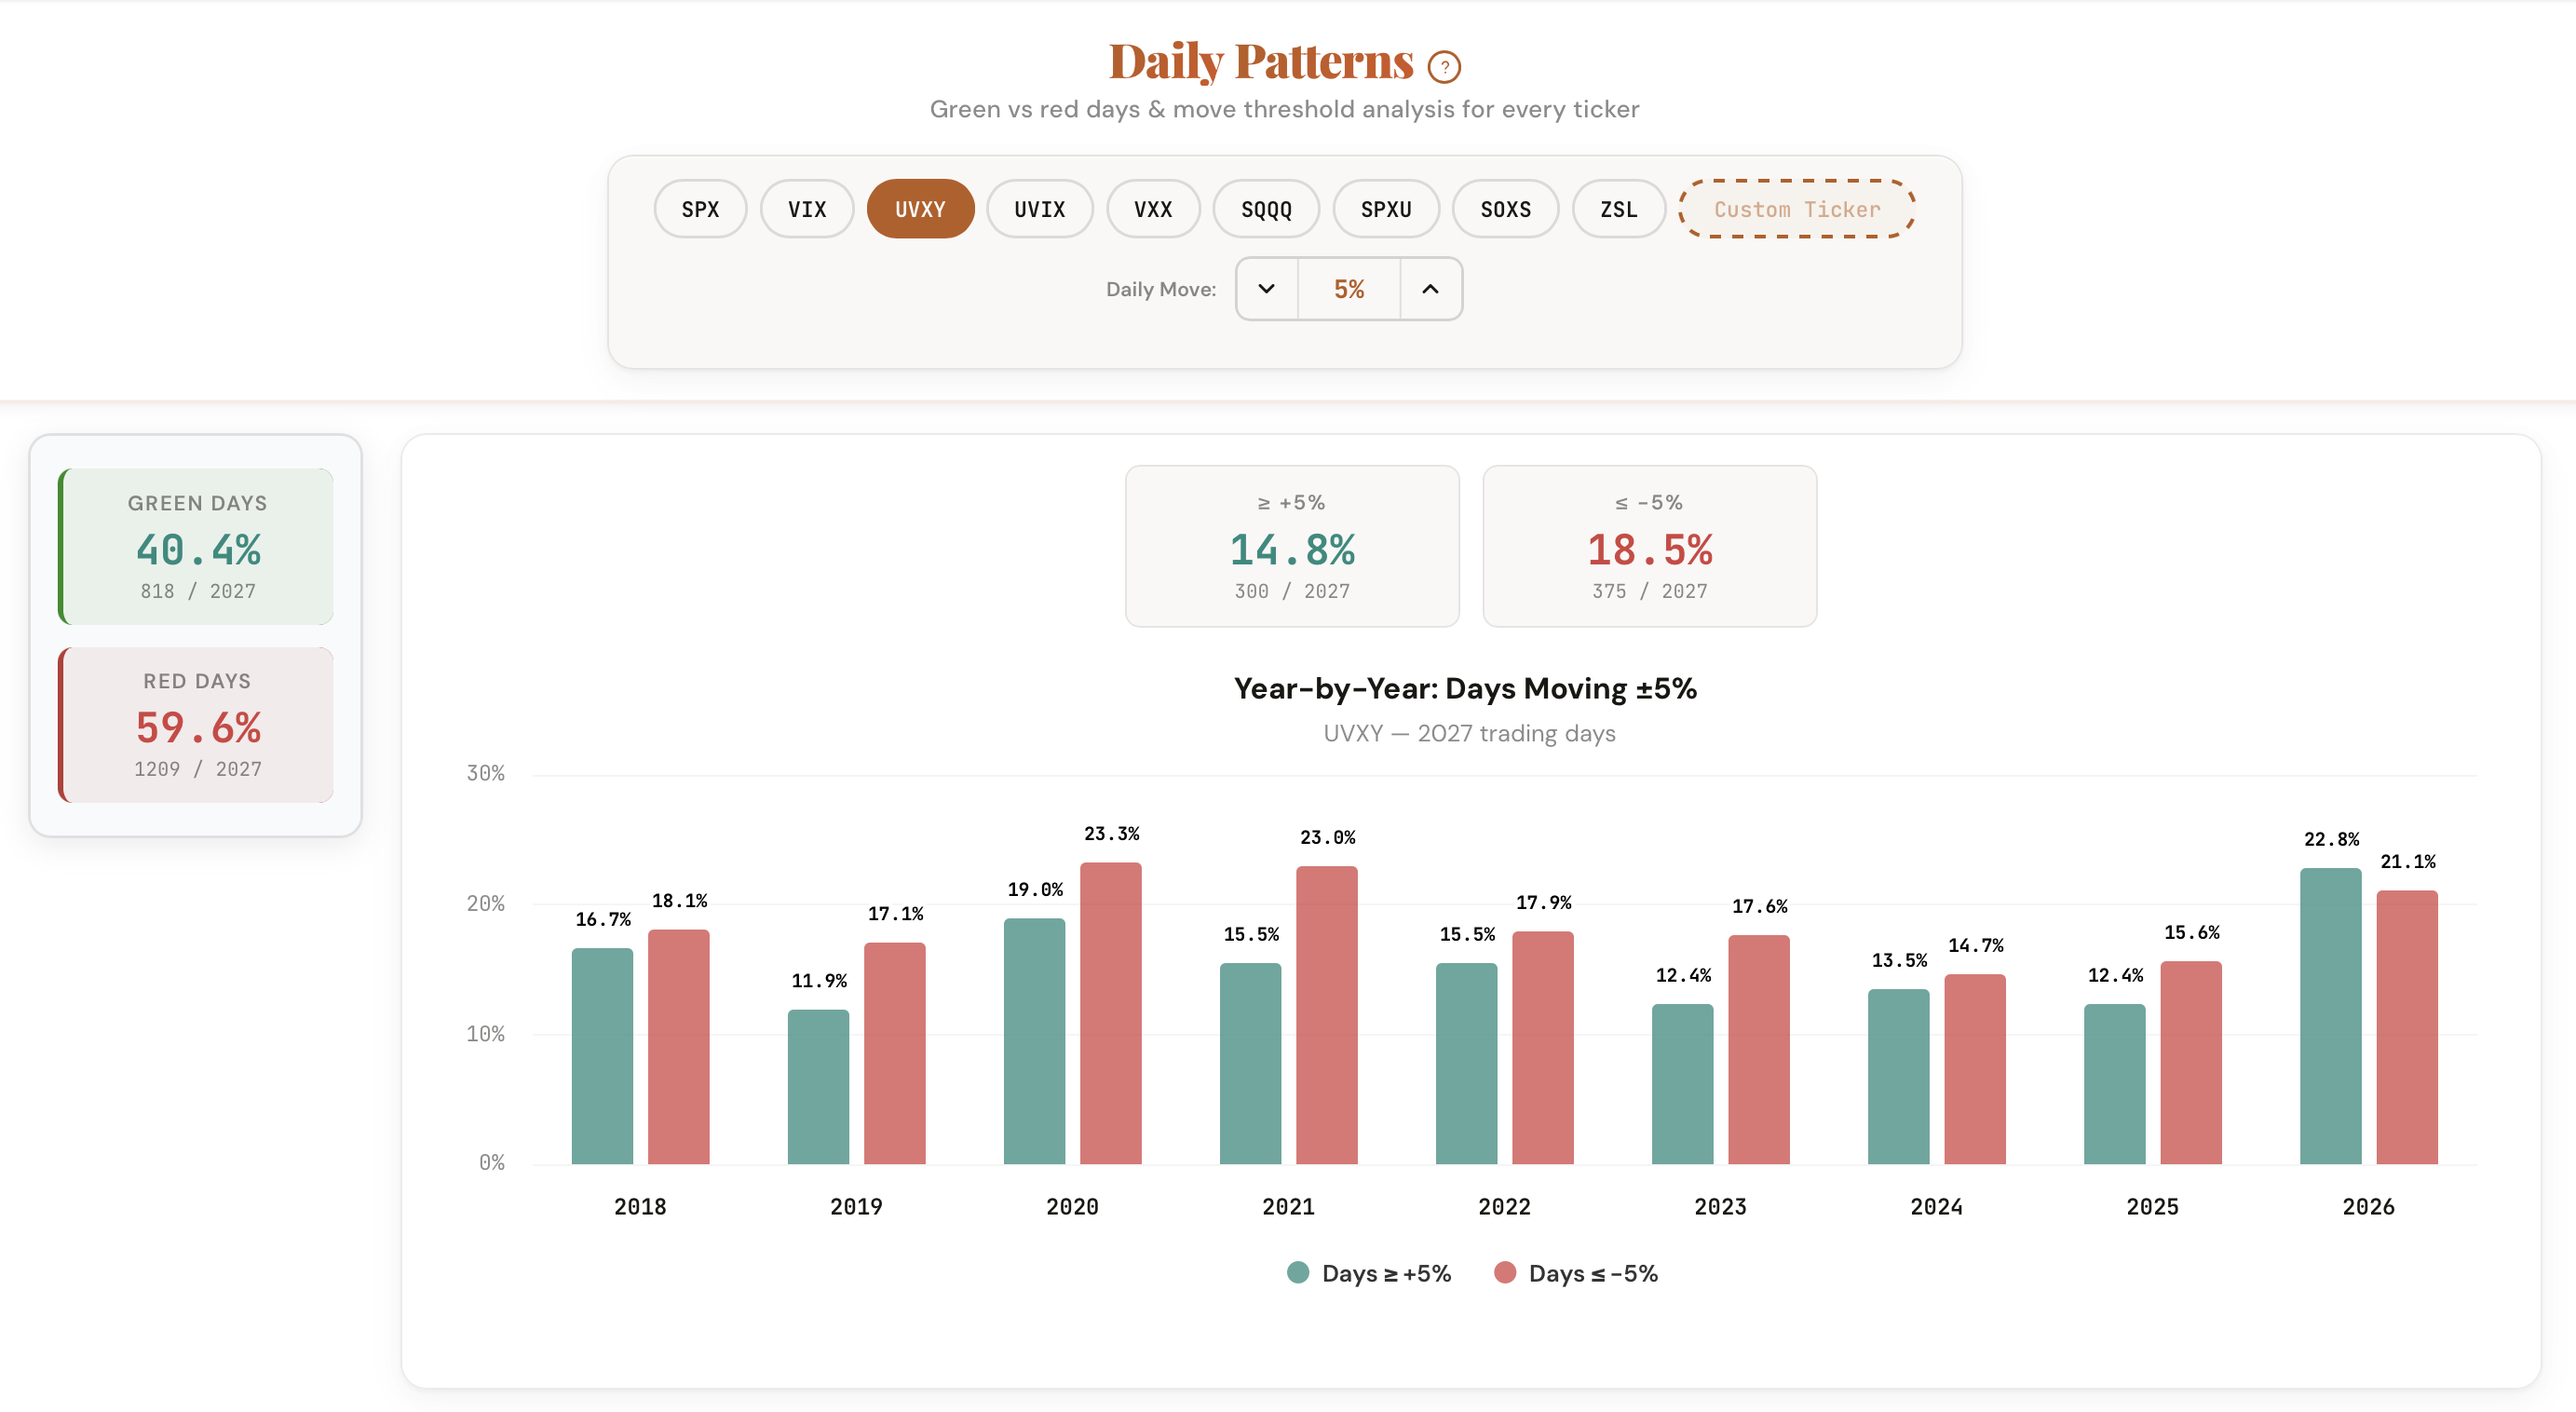
January 2, 2026
How Often Does Your Ticker Actually Have a Green Day?
Green vs red day ratios, move threshold analysis, and year-by-year breakdowns for every ticker.
Read more
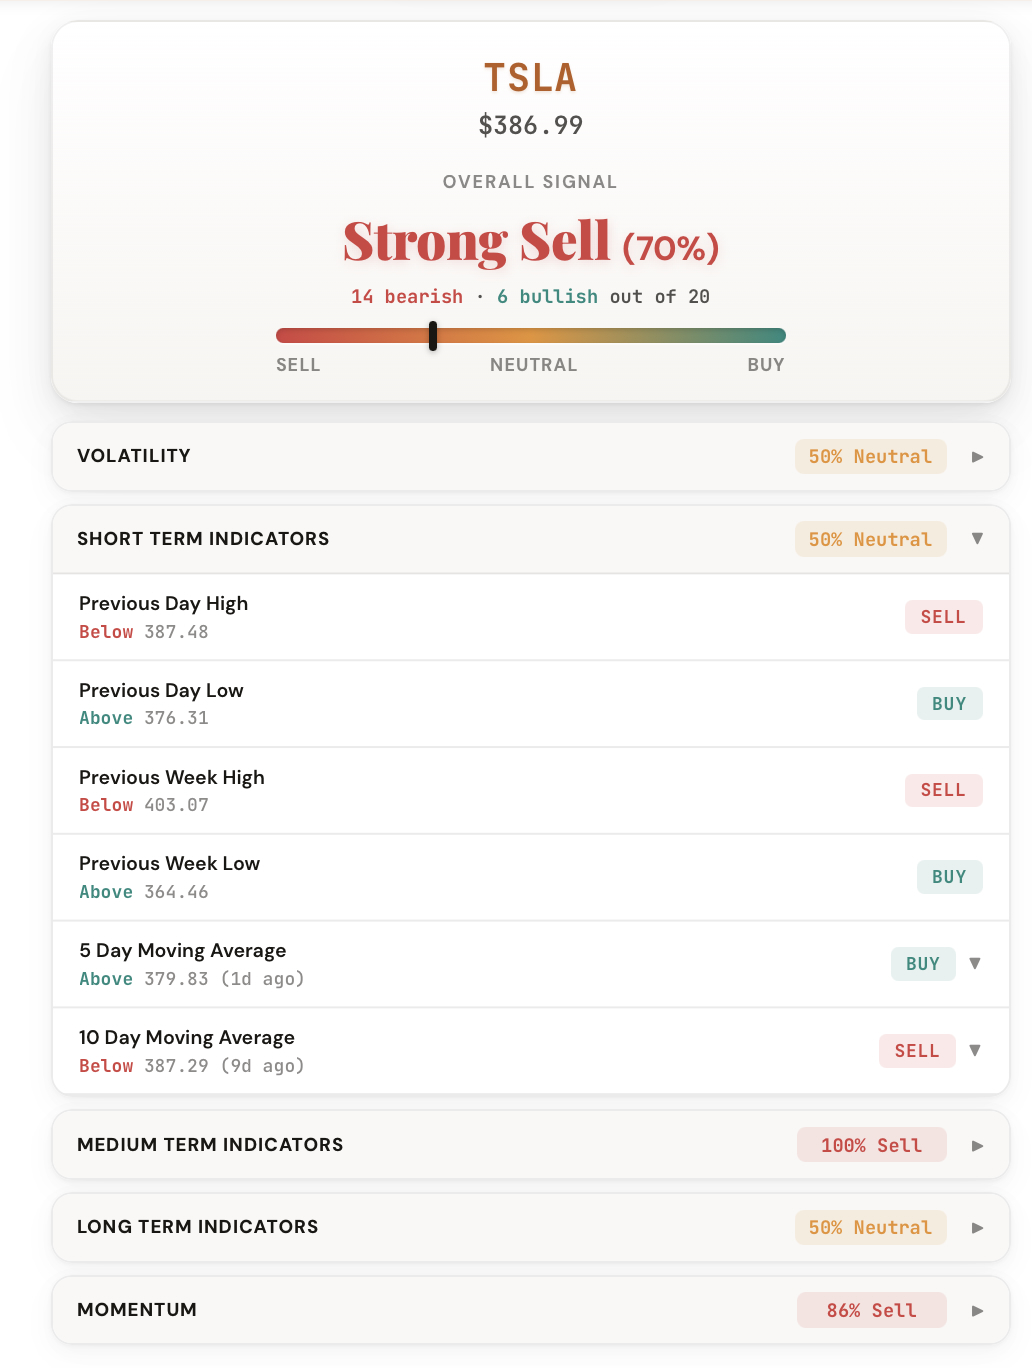
December 29, 2025
Is the Market Bullish or Bearish Right Now? 20 Indicators Give You the Answer Instantly
Type any ticker and get an instant bullish or bearish read across 20 key technical indicators.
Read more