You have 10+ tools at your disposal. Each one answers a different question. But when you are looking at a single ticker and trying to form a view, you end up opening tool after tool, entering the same ticker, waiting for data, reading the output, then moving to the next one.
Our X-Ray tool eliminates that process entirely. Select a ticker and every tool runs at once. The results appear on a single page, organized into clear signal cards. No tab switching. No re-entering symbols. One click, every signal.
How It Works
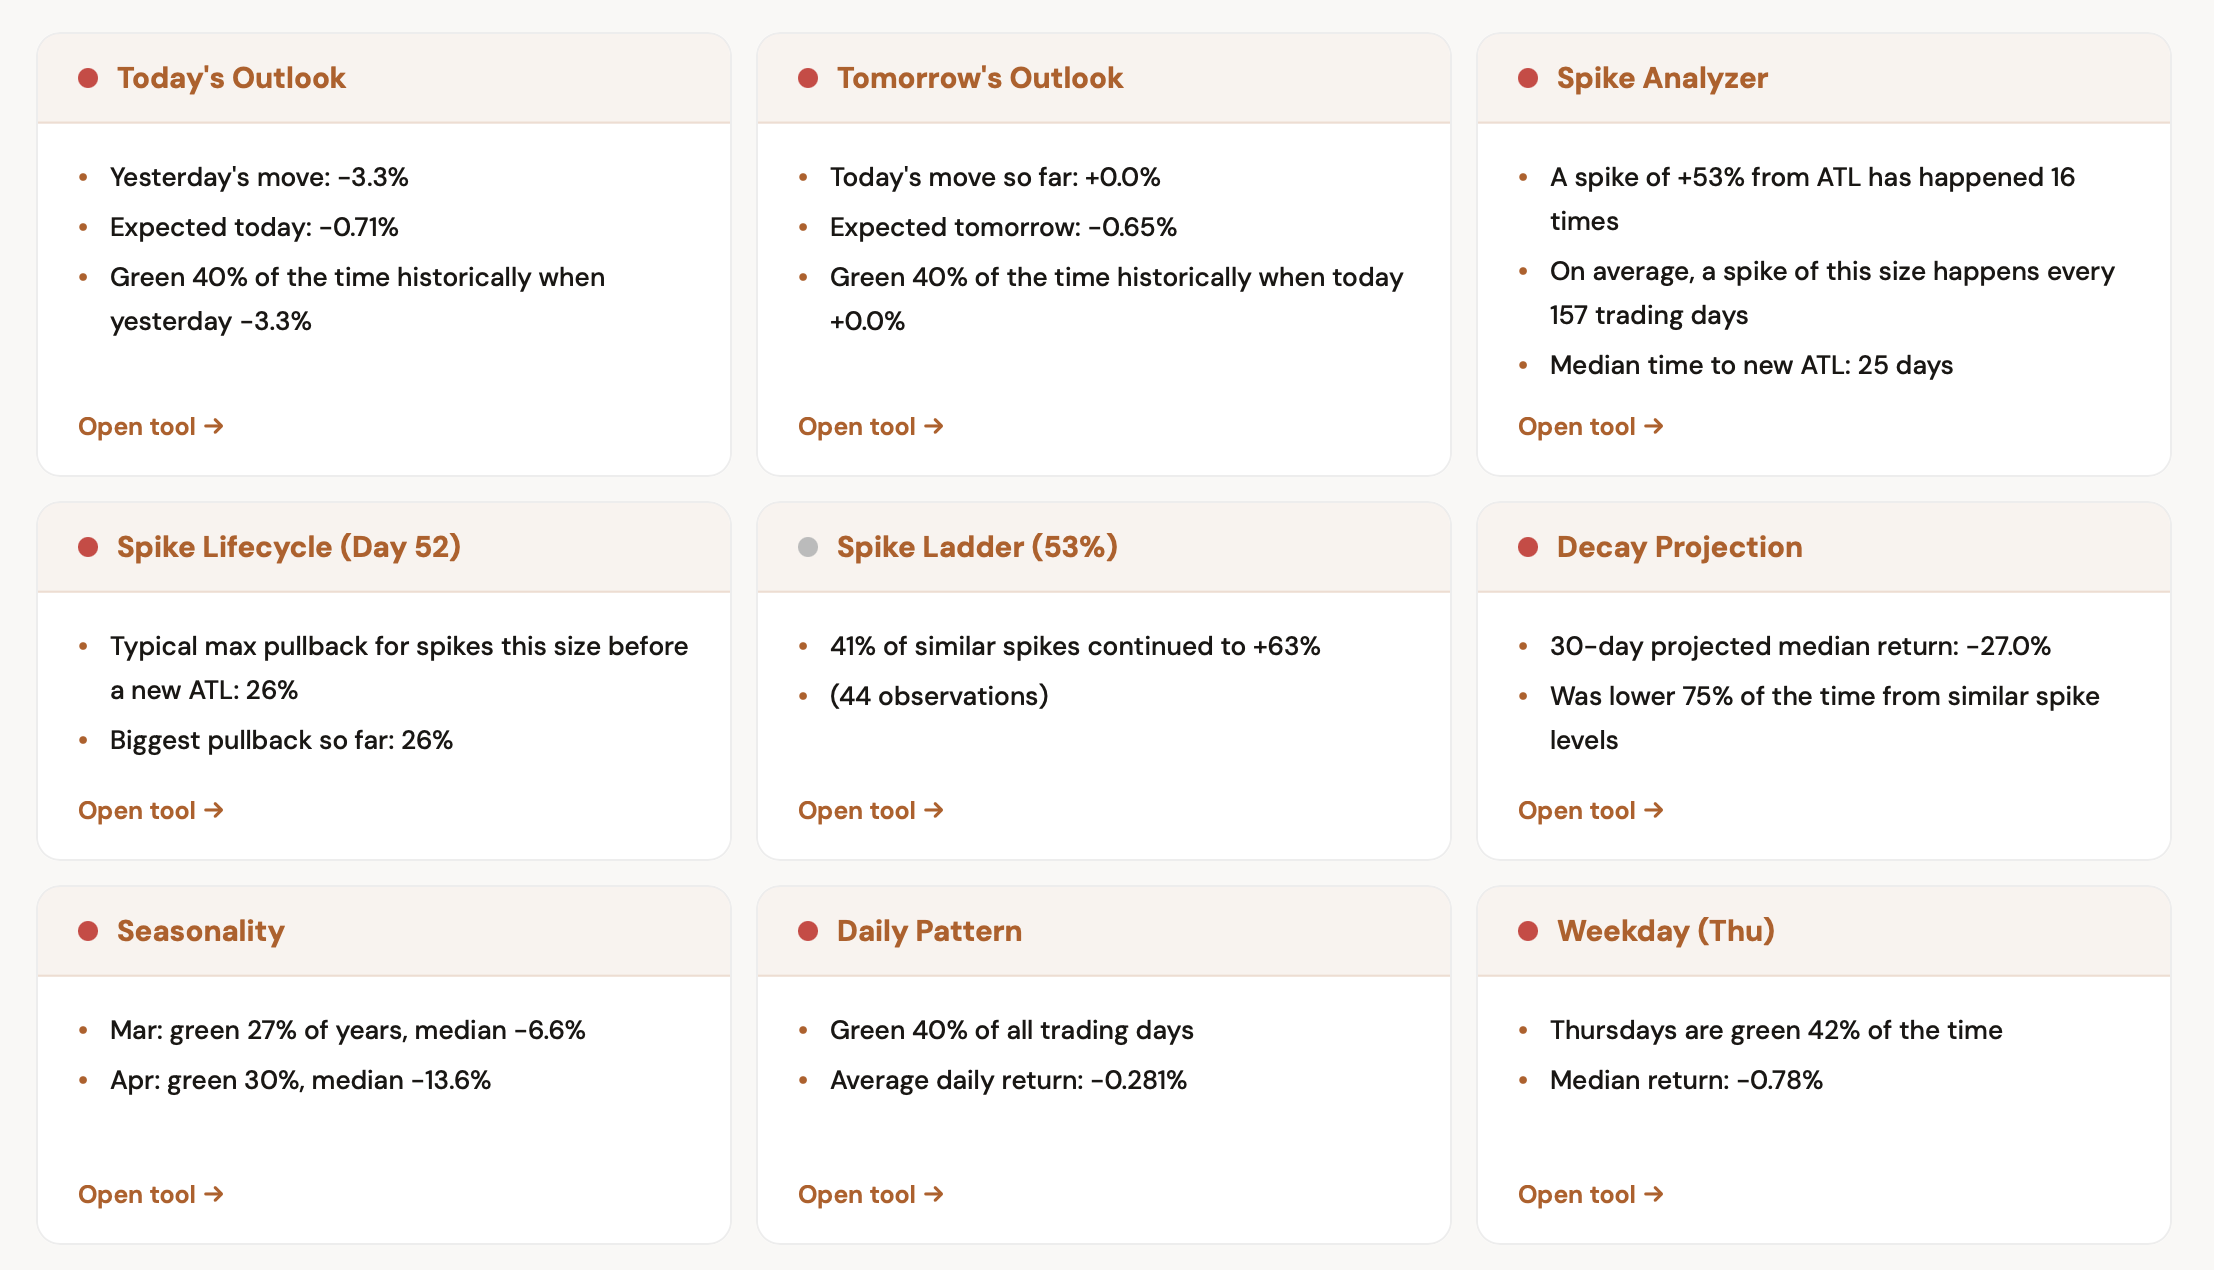
Open the X-Ray page from the sidebar or the header navigation. Select one of the pre-loaded tickers or type in a custom one. The system fetches historical data, runs it through every applicable tool, and displays the results in a grid of signal cards.
Each card shows the tool name, the key finding, and a direct link to open that tool with the ticker pre-loaded so you can dig deeper.
Why It Matters
Most traders check one or two signals before making a decision. X-Ray forces you to see all of them at once. Sometimes the signals align and the trade is obvious. Other times they conflict, and knowing that conflict exists is just as valuable.
The goal is to make sure you are not missing something before you act.