You open a tool. The data loads. Numbers fill the screen. Now what?
That gap between seeing the data and knowing what to do with it is where most traders lose time. You run the numbers, compare them mentally, try to remember what the thresholds are, and eventually form an opinion. We wanted to close that gap.
Starting today, every tool in the CI Volatility suite includes a built-in Analyst Note that reads the data on your screen and translates it into a plain-English recommendation.
How It Works
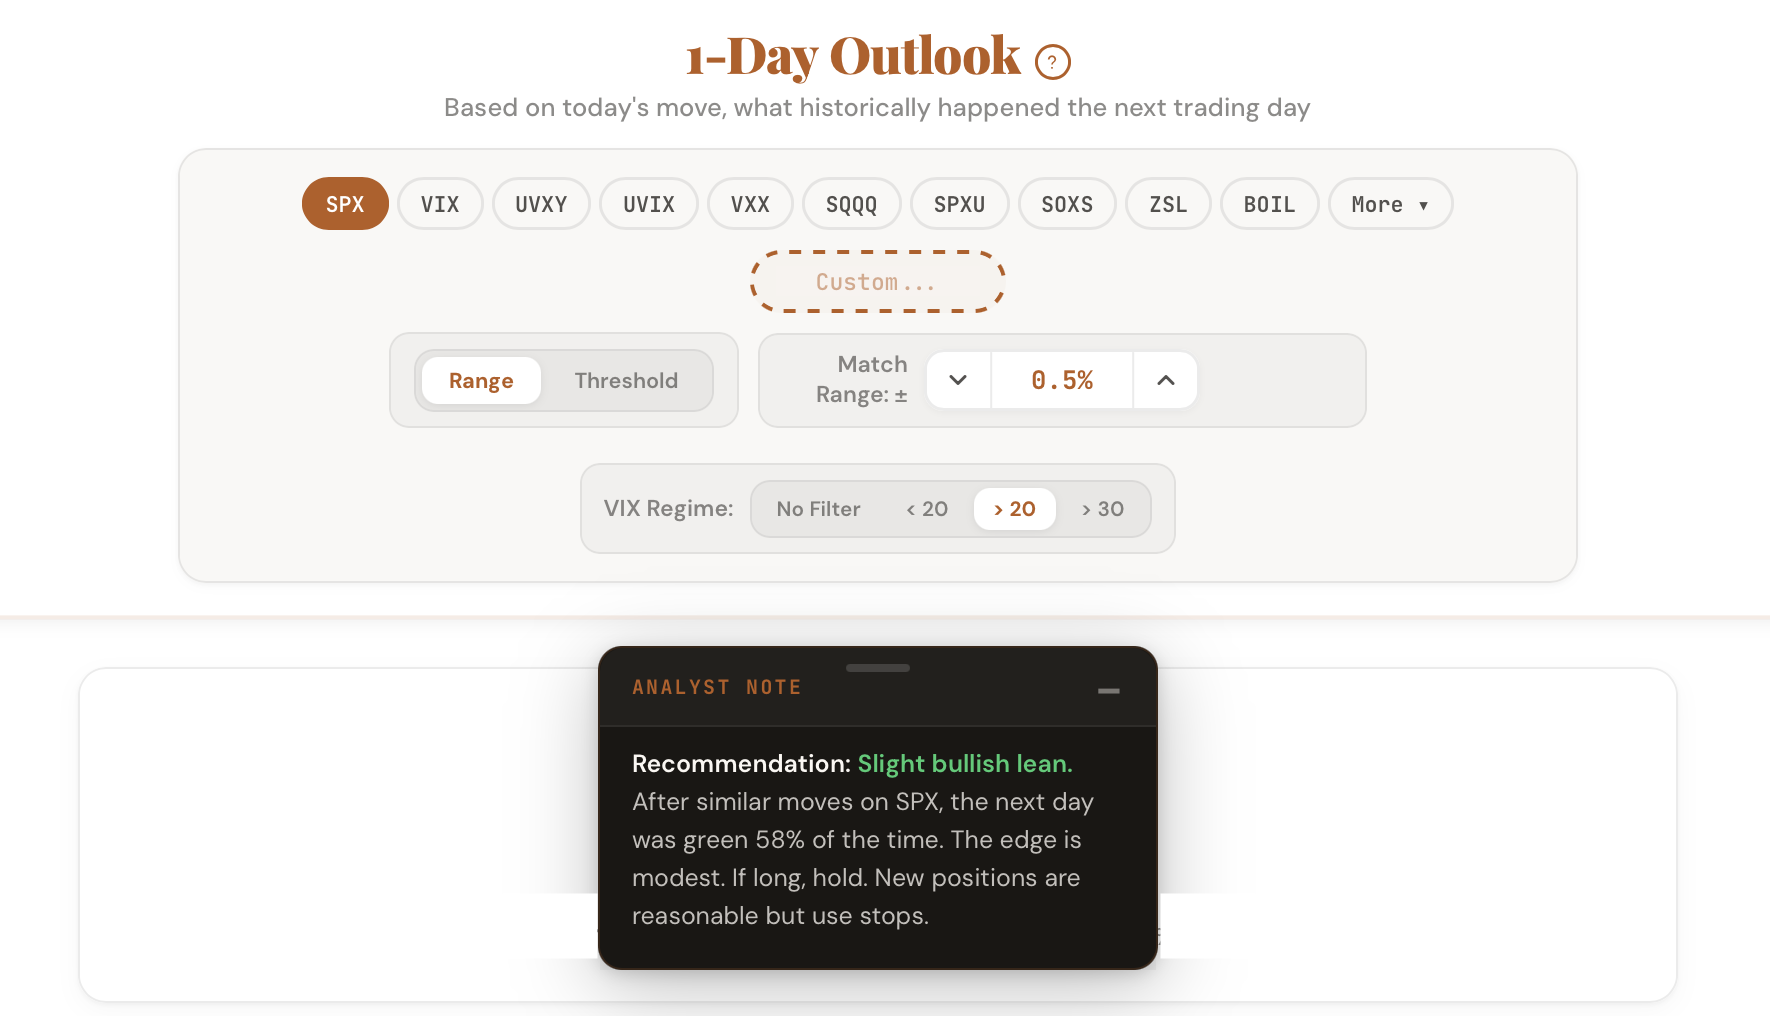
The Analyst Note is a small floating card in the bottom-right corner of every tool. It updates automatically whenever you change a ticker, adjust a parameter, or toggle a filter. There is no button to press. The note reads the same data you are looking at and states the conclusion in words.
Click the question mark icon to expand it. Click minimize to tuck it away. Drag it anywhere on your screen. It remembers your preference for the session.