Tool Deep Dive
April 6, 2026

After 3 Red Days in a Row, What Happens Next?

Does a losing streak set up a bounce, or is it just the start of a bigger move? The Post-Streak Analysis answers with historical data.

Three red days in a row. Your ticker is down and the panic is building. Everyone has an opinion: "it's oversold, buy the dip" or "the trend is your friend, stay short." But what does the data actually say?

The Streak Analyzer's Post-Streak Analysis answers this question by looking at every historical instance of a consecutive streak and measuring what happened next.

Three Cards, One Answer

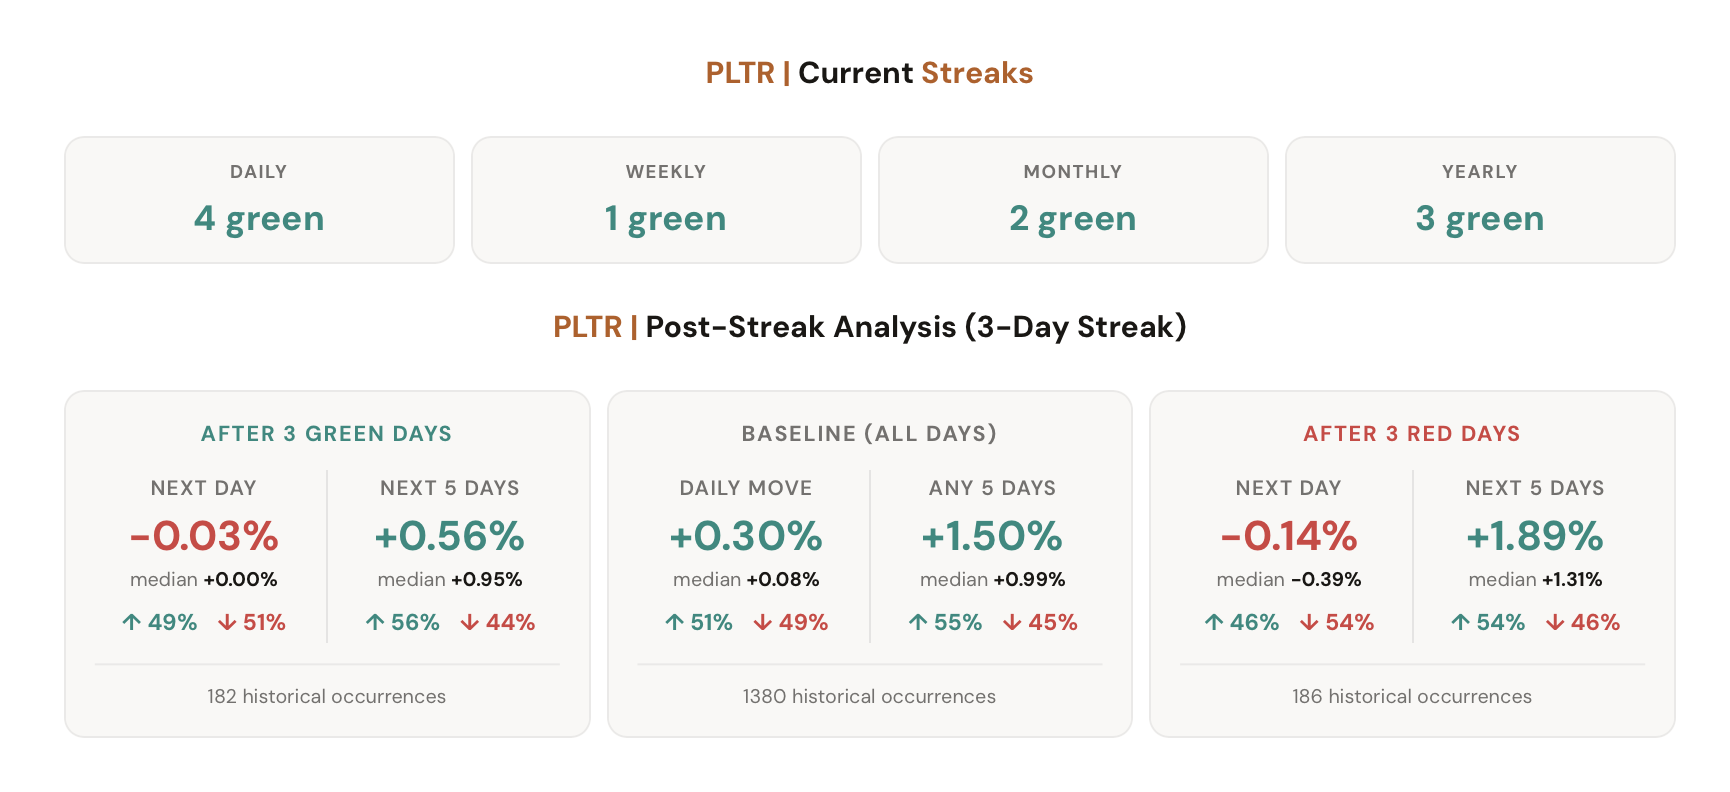
The Post-Streak Analysis displays three cards side by side. The first shows what happened after N consecutive green days. The third shows what happened after N consecutive red days. And the middle card is the baseline: what happens on any given day, with no streak filter at all.

Each card breaks the forward returns into two time horizons. Next Day shows the close-to-close return on the very next trading day after the streak ends. Next 5 Days shows the cumulative return five trading days out. For the baseline card, these are labeled Daily Move and Any 5 Days since there's no streak condition.

For each time horizon, you see four stats: the average return, the median return, and the percentage of times the next move was green vs. red. This gives you a complete picture of the distribution, not just a single number.

Post-Streak Analysis showing next-day and 5-day returns after green and red streaks

The Baseline Is the Key

The most important card is the one in the middle. The baseline shows what the ticker does on a normal day with no streak filter. If the "After 3 Red Days" card shows an average next-day return of +0.45%, but the baseline daily move is already +0.40%, then the streak isn't telling you much. The edge is only 5 basis points.

But if the baseline daily move is +0.10% and the post-red-streak return is +0.55%, now you have something. The streak condition is producing a meaningfully different outcome than random. That's the kind of signal worth paying attention to.

Always compare the green and red cards against the baseline. Without this comparison, you can't tell whether a streak actually predicts anything or whether it's just noise.

What Each Stat Tells You

Six metrics that define the post-streak edge.

Metric

Average Return

The mean forward return after the streak. Tells you the expected value of the next move, but can be skewed by outliers. Compare it to the baseline average to see if the streak changes the expected outcome.

Metric

Median Return

The middle value of all forward returns. More robust than the average because it ignores extreme outliers. If the median and average diverge, it means a few large moves are pulling the average in one direction.

Metric

Green vs. Red %

How often the next move was positive vs. negative. A 60% green rate after 3 red days means the bounce happened more often than not. Pair this with the average return to see if the wins are also larger than the losses.

Metric

Baseline Comparison

The unconditional daily move and 5-day return with no streak filter. This is your control group. If the post-streak stats don't meaningfully differ from baseline, the streak has no predictive value for that ticker.

Metric

Adjustable Streak Length

Change the streak length from 2 to 10+ consecutive days. A 2-day streak is common and may show little edge. A 5-day streak is rare and may show a stronger signal, but with fewer historical samples to draw from.

Metric

Two Time Horizons

Next Day captures the immediate reaction. Next 5 Days captures the follow-through. Sometimes the bounce happens on day 1 but fades by day 5. Sometimes day 1 is flat but the 5-day return is strongly directional.

How to Read the Cards

Start with the baseline card. Note the average daily move and the green percentage. This is your reference point. Then look at the green streak card and the red streak card. Ask yourself: is the average return meaningfully different from baseline? Is the green/red split materially shifted?

If the baseline green percentage is 53% and the post-red-streak green percentage is 54%, there's no edge. But if it jumps to 62%, that's a statistically interesting difference, especially if backed by a reasonable sample size.

Pay attention to the sample count shown on each card. A post-streak average based on 8 occurrences is far less reliable than one based on 80. The Streak Analyzer will show "Too few samples" if there are fewer than 3 data points, but even 10-20 samples should be treated with caution.

Finally, compare the 1-day and 5-day horizons. A ticker might show a strong next-day bounce after red streaks but a flat 5-day return, suggesting the bounce is short-lived and mean-reverts quickly. Or the opposite: a weak day 1 but a strong 5-day move, suggesting the real opportunity is in holding through the noise.

Four Ways to Use This

Practical exercises for streak-based analysis.

1

Check if red streaks set up bounces

Open the Streak Analyzer for UVXY. Set the streak length to 3 and compare the "After 3 Red Days" card to the baseline. Is the next-day return meaningfully higher? Is the green percentage elevated? If so, red streaks may be a buy signal for that ticker.

2

Test different streak lengths

Change the streak length from 3 to 5 and see how the stats shift. Longer streaks are rarer but may show a stronger edge. If the signal gets stronger with longer streaks, that's more convincing than if it stays flat or weakens.

3

Compare across tickers

Run the same streak analysis on UVXY, PLTR, TSLA, and SPY. Some tickers are strong mean-reverters after streaks. Others trend. The Post-Streak Analysis reveals which behavior dominates for each product.

4

Separate signal from noise

If the post-streak stats look almost identical to baseline, the streak has no predictive power for that ticker. This is just as valuable as finding an edge. It tells you not to waste time trading a pattern that doesn't exist.

See What Happens After the Streak

Open the Streak Analyzer and scroll down to the Post-Streak Analysis. The data is already there. You just have to look.

Open the Streak Analyzer

Comments

Loading comments…