Pick a ticker, a spike threshold, a profit target, and a stop loss. The tool walks 20+ years of bars, fires a short on every qualifying spike off the running all-time low, and shows you every trade.
Volatility ETFs decay. UVXY, VXX, SQQQ, SOXS, BOIL: every leveraged or inverse product on the long side of fear leaks value over time. The structural force is contango on the underlying futures, plus the daily-reset rebalancing math. On most days, you can short these and they'll grind down for you.
The problem is the days they don't. UVXY can spike 50%, 100%, even 200% in a few sessions when fear hits. If you're naked short into one of those, decay isn't going to save you fast enough. The honest version of the trade is: wait for the spike, then short. The question is which spike size to wait for, what profit target to take, and where to stop out before the spike blows past you.
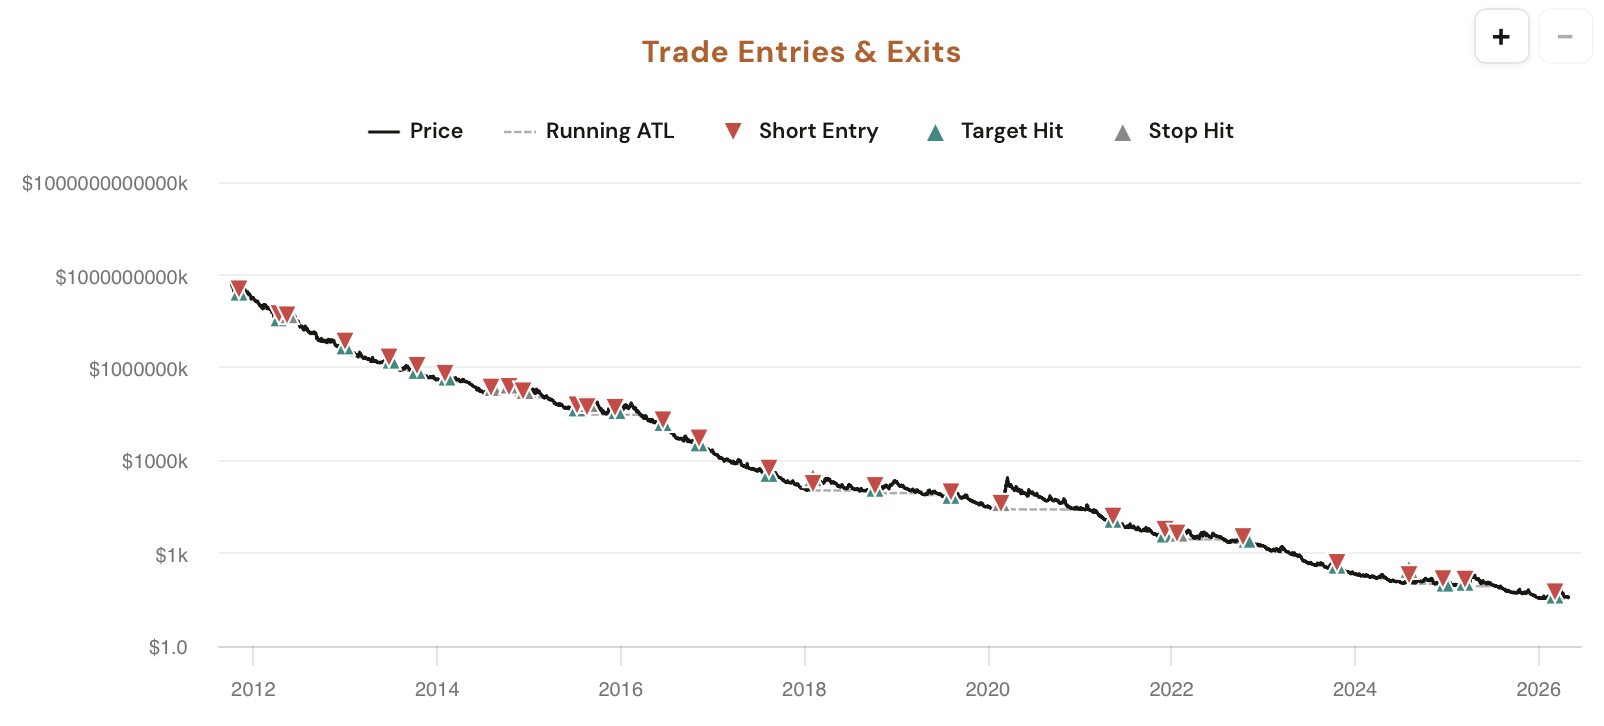
Pick any of the 15 vol/inverse-ETF presets (UVXY, UVIX, VXX, SQQQ, SOXS, ZSL, BOIL plus 8 more in the More dropdown). Set three numbers: Entry Spike % (how far above the running all-time low you want the price before going short), Profit Target (the SHORT P&L at which you take profit), and Stop Loss (the SHORT P&L at which you cut). The tool runs the whole 20+ year history bar by bar and reports every trade.
UVXY at +50% spike off its ATL with a 10% profit target and 5% stop loss historically wins about 7 out of 10 trades. That's the kind of read you get back: concrete win rates, average trade size, the best and worst single trades the strategy ever recorded, and a click-to-expand trade log with every entry and exit.
Three knobs, five stats, one chart, and a full trade log. Every entry traced back to the moment a fresh all-time low armed the strategy.
UVXY, UVIX, VXX, SQQQ, SOXS, ZSL, BOIL up front; DUST, FAZ, GLL, LABD, SCO, SPXU, TSLQ, TZA in the More dropdown. The full set of leveraged shorts and inverse vol products that decay structurally.
How big a spike off the running all-time low arms a short. Default 50%. Step it up if you want only the biggest spikes; step it down to fire on smaller setups. Range 1–1000%.
Both set in % of SHORT P&L. The trade exits the moment whichever number is hit first. Default profit target 10%, stop loss 5%. Range 5–50% on each.
The strategy only re-arms when a new all-time low is set. That keeps each spike measured off a fresh base: one entry per ATL leg, no double-firing inside the same drawdown.
Five cards above the chart: Win Rate, Avg Trade, Best Trade, Worst Trade, and Avg Days in Trade. Hover any card for the active filter context (ticker + spike level).
Collapsible table beneath the stats: every trade with entry date, entry price, exit date, exit price, days held, and return. Useful for spotting whether the win rate is one good year repeated or stable across regimes.
The simulation runs in two passes over the ticker's daily history.
(entryPrice − close) / entryPrice.Exits are evaluated at the close of each bar, not intraday. If a vol ETF gaps up massively against your short overnight, the next close can be far worse than your stated stop. That's why you'll occasionally see a "Worst Trade" of −30% or even −60% on a strategy with a nominal 5% stop. The gap blew through the level. It's a real characteristic of trading vol products on the short side, and the trade log surfaces every instance so you can size accordingly.
Five ways members are already applying the Spike Backtester to their process.
Step the Entry Spike % from 25% to 100% in 5% increments and watch the win rate, average trade, and trade count change. The combinations with the highest win rate often have very few trades (over-fit to a few big spikes). The combinations with the most trades often have a worse win rate. Find the corner of the curve that fits your patience.
The Worst Trade card and the trade log show what happens when the stop fails: gap-up days where the strategy exits far past the stated stop. If a 5% stop has a Worst Trade of −40%, you need to size for the −40% reality, not the 5% intent.
Cycle through UVXY, UVIX, VXX, SQQQ, SOXS, ZSL, BOIL at the same spike threshold. Different products have different decay characteristics and different gap profiles. The same strategy that works on UVXY might be a disaster on BOIL.
UVXY (1.5x VIX) and UVIX (2x VIX) are similar tickers with different leverage. Run the same parameters on both and compare win rate vs worst-trade. Whichever side of the trade-off you prefer is now a defensible pick rather than a feel.
A 70% win rate on 12 trades with one −50% loss is a different proposition than a 70% win rate on 80 trades with a worst loss of −15%. Open the trade log, scan for outlier losses, and decide if your account can survive whichever single worst trade has happened in the past.
Spike Shorting is in your dashboard under Volatility Tools. CI Volatility members can adjust all three parameters; free users see the locked default run.
Open Spike Shorting
Comments
Loading comments…