The Lab
January 2, 2026

Is Your Price Target Realistic, or Wishful?

Set your price target and the Probability Lab tells you the exact percentage of historical periods that hit it.

Most traders sell options, set stops, or pick targets on instinct. "SPY won't drop 2% today, that's rare." Maybe. But how rare is rare?

The honest answer needs three things you usually don't have on hand: the historical frequency at that move size, the same number for the actual holding period you're trading (a week of 2% moves is very different from a day of 2% moves), and the same number again filtered to the volatility regime you're in. Calm markets and panicked markets produce completely different probabilities.

The Probability Lab

Probability Lab showing the upside and downside probability cards with price targets and a year-by-year column chart

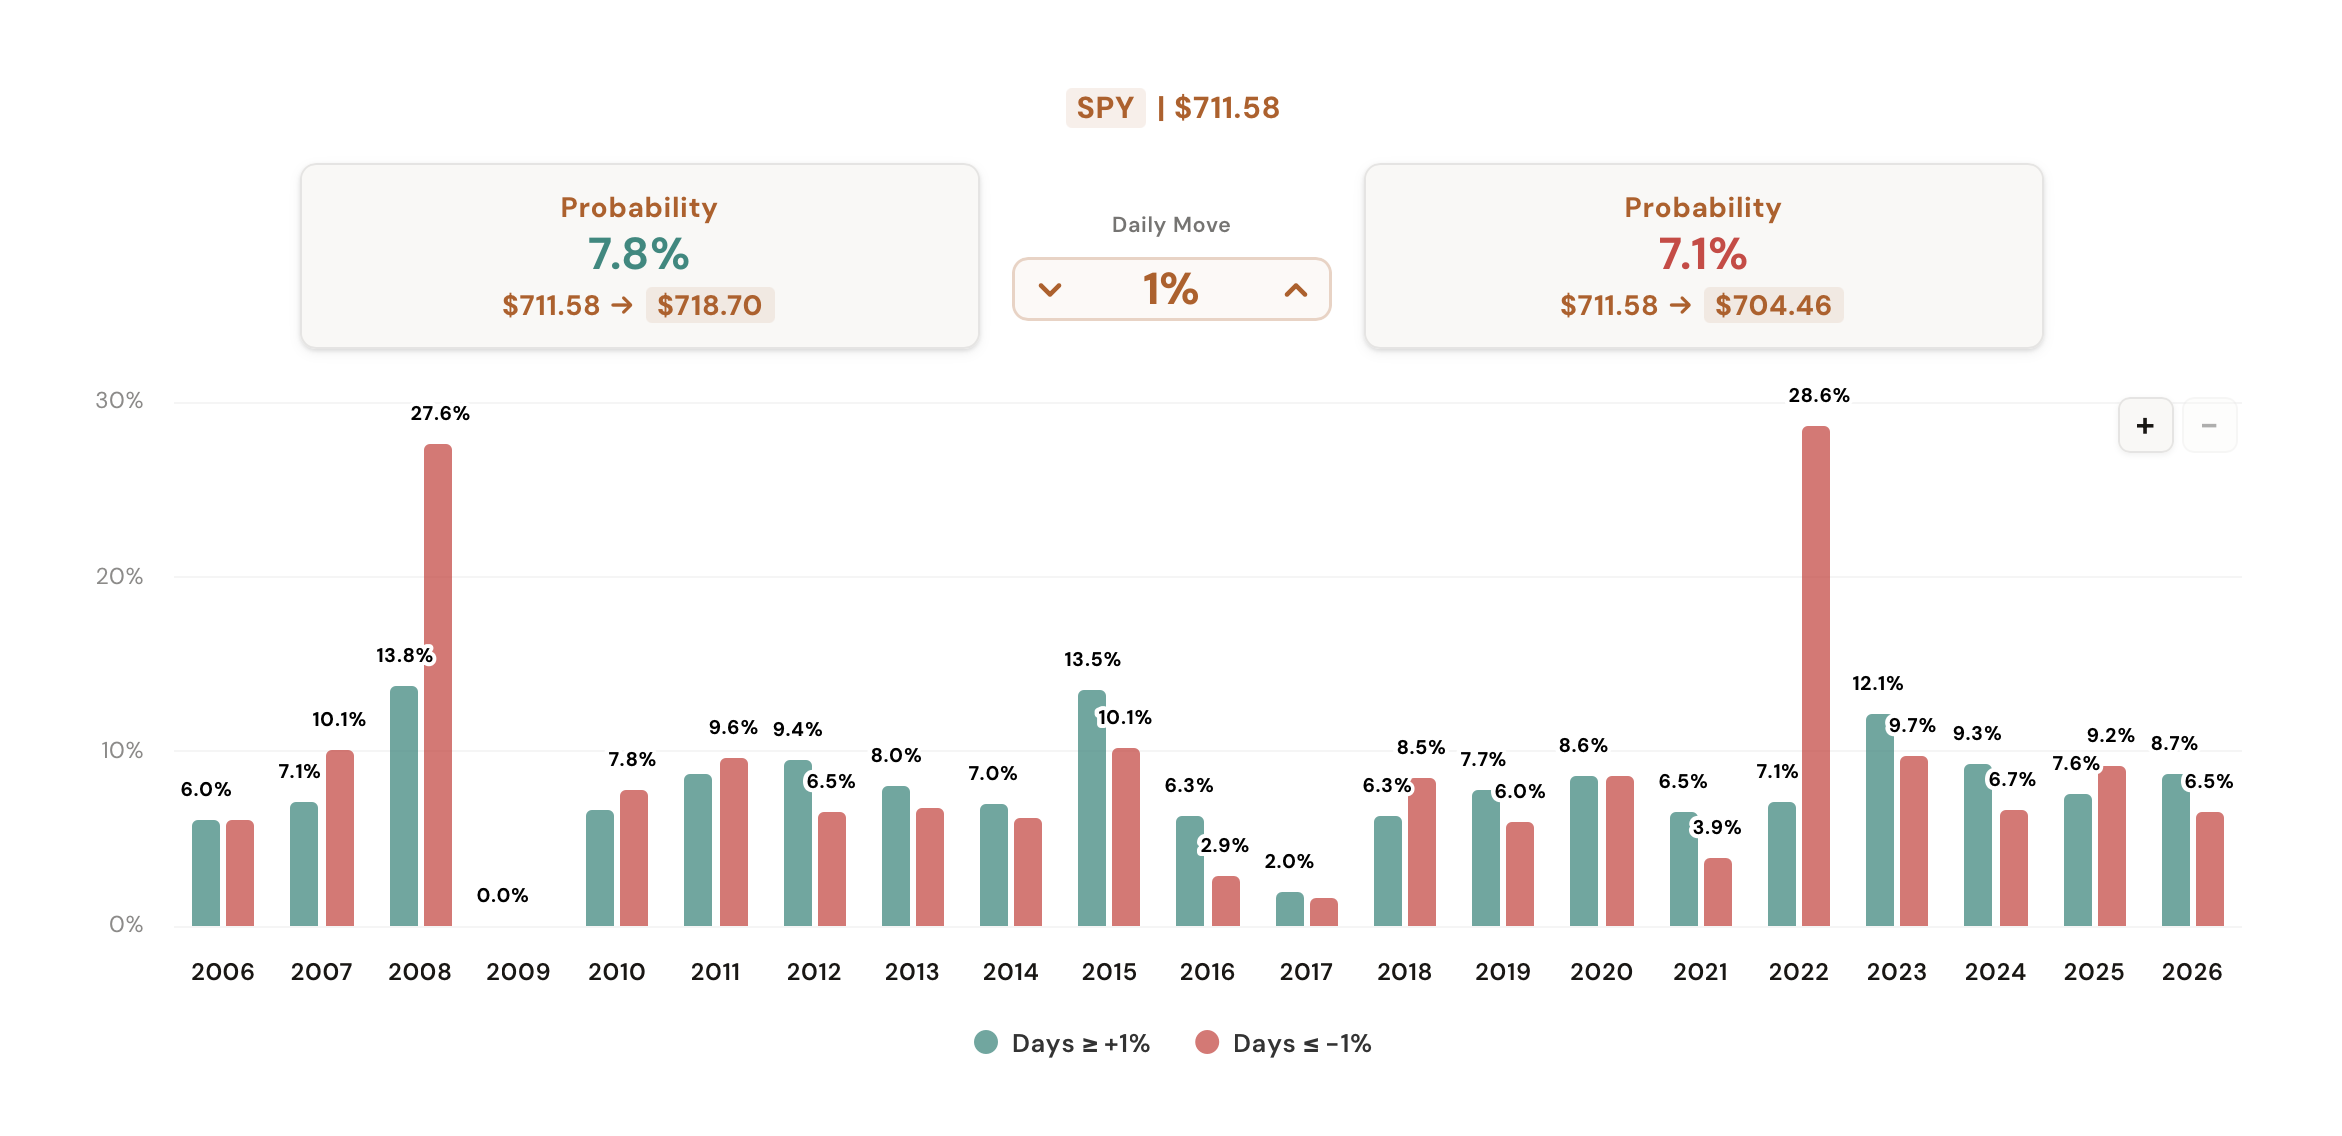
Pick a ticker, set a threshold, hit go. Two cards above the chart give you the exact answer: Probability ≥ +N% and Probability ≤ -N%, each as a percentage of historical periods plus a live price target: current price → up or down side at that move. Below them, a column chart breaks the same probabilities down year by year so you can see whether the read is stable, trending, or fading.

Three controls reshape the answer. Period swaps Daily / Weekly / Monthly so you're measuring the holding period you actually trade. VIX Regime filters historical periods to only those that opened with VIX under 20, between 20 and 30, or over 30 (calm markets, normal markets, panicked markets, all separate populations). Filter By switches between two definitions of "moved": Close (where the period ended) and Touch (whether the high or low ever reached your threshold intraperiod).

What the Tool Shows You

Two probability cards, a price target, and a year-by-year breakdown. Every reading filterable by period, VIX regime, and Close vs Touch.

Headline

Up & Down Probability Cards

"Probability ≥+N%" and "Probability ≤-N%": the historical frequency that the ticker has crossed your threshold in either direction. Plus a live price target so you can see exactly where +1% or -2% lands today.

Threshold

Stepper Anywhere From 0% Up

Step the threshold up or down right between the cards. The cards, the chart, and the analyst note all re-read instantly. Step it to 0% and the cards switch to a Green vs Red ratio for that period.

Period

Daily, Weekly, Monthly

Daily mode is close-to-close. Weekly aggregates Mon–Fri into one bar. Monthly aggregates a calendar month. The probability for "+2% in a day" and "+2% in a month" are very different reads.

Definition

Close vs Touch

Close only counts periods that ended beyond your threshold. Touch counts any period that ever printed beyond it intraperiod, regardless of where it closed. Touch is the right read for stops; Close is the right read for short options.

Regime

VIX Regime Filter

Restrict the historical sample to periods that opened with VIX under 20, between 20 and 30, or over 30. The probabilities shift dramatically between regimes. This is how you trade today's market, not the average market.

Trend

Year-by-Year Column Chart

The same threshold probability broken down by year. Two series: Up Side and Down Side. Lets you see whether tail-risk frequency is stable, trending, or concentrated in a few outlier years.

How It Works

The tool pulls 20 years of daily bars for your ticker plus the matching VIX bars, then walks every period in the history.

Period aggregation

Threshold matching

For each period the tool computes three numbers: the period return, the period high return (high vs prior close), and the period low return (low vs prior close). Then it counts:

VIX regime filter

If a regime is selected, the tool looks up the VIX opening price for each period's first day and includes only periods where VIX opened in the chosen band: under 20, between 20 and 30, or over 30. Periods without a VIX print on their open day are excluded from the sample. The Probability cards and the year-by-year chart both read off the filtered sample.

Year-by-year breakdown

After the same threshold matching is run on every period, results are bucketed by year. The chart shows the percentage of that year's periods that hit your threshold: up side green, down side red. In Monthly mode the bars label with raw counts (e.g. 3x) instead of percentages because the per-year denominator is only twelve.

All calculations run in the browser the moment you change a control. No server, no caching delay, no rate limit on how many tickers you check.

How Traders Are Using It

Five ways traders are applying the Probability Lab to their process.

1

Sizing short options by Touch

Before selling a put or call, set Filter By to Touch and check how often the ticker has touched your strike intraperiod, not just how often it closed there. The Touch number is what actually defines whether you got tested, and it's typically much higher than the close-only number.

2

0DTE in the current regime

Selling 0DTE SPX or SPY? Pick Daily, set the threshold to your strike distance, and switch the VIX Regime to whichever band today's VIX opens in. The probability you care about is conditional on this VIX, not the unconditional 20-year average.

3

Setting realistic stops

If you're risking a 2% stop on a daily SPY trade, look up how many days have intraperiod-touched -2% in the regime you're in. Touch frequency tells you how often that stop gets hit, including on days that recover before the close. Close-only frequency would understate it.

4

Comparing tickers at the same risk

Step the threshold to 3%. Now Daily-Touch on SPY vs QQQ vs TSLA at the same VIX regime gives you three numbers that are directly comparable. Use it to find the ticker whose volatility profile matches the trade you want.

5

Spotting trend in the year-by-year chart

If 4%+ down-side touches were rare from 2014–2018 but show up in 5+ years out of the last 6, the volatility profile of the ticker has shifted. The historical 20-year average is a worse guide than the recent year-by-year trend, and the chart shows you which one to trust.

Try it on the trade you're sizing now

Free users get the Daily / Close / No-Filter slice on any ticker. Members unlock Weekly & Monthly periods, the VIX Regime filter, and the Touch definition.

Open the Probability Lab

Comments

Loading comments…