Most moving average backtests you see online are built around a flaw: they exit trades when another moving average crosses. Buy above the 50-day, sell below the 200-day. Or enter on a golden cross, exit on a death cross. It sounds disciplined until you look at what it actually costs.
By the time a stock closes below its 200-day MA after a long uptrend, it's already given back 20% to 30% of its gains. By the time a death cross prints, the damage is already done. MA-based exits are slow and lossy. They don't match how any real trader actually manages risk.
We rebuilt the Moving Average Backtester around a simpler, more realistic question: what if you kept the MA as the entry signal you believe in, but exited the way real traders exit — with a profit target and a stop loss?
How It Works
Pick a strategy, pick an MA (or MA pair), set your exits. The tool runs the backtest on the ticker's full history and shows you the real results.
Two Entry Strategies
Price Cross — Buy when price closes above the MA you choose. A classic trend-following entry. Pick SMA or EMA, pick the period, done.
Golden Cross — Buy when a short MA crosses above a long MA. The most widely discussed bullish setup in technical analysis. Defaults to 50/200, but you can test any pair.
One Exit Model
Both strategies exit the same way: a profit target (% gain from entry) or a stop loss (% loss from entry), whichever hits first on any daily close. No second MA to wait for. No death cross that prints after the damage is done. Just the exit rule you'd actually use.
Profit Target and Stop Loss are configurable from 5% to 50% in integer steps. Defaults start at a 10% target and 5% stop.
Find Best Combination for Selected MA
Here's where the tool pays off. Once you've picked the MA signal you trust, click Find Best Combination for Selected MA. The tool sweeps every integer combination from 5% to 50% for both the profit target and the stop loss — 2,116 combinations — and returns the pair that produced the highest historical annualized return with your MA.
In Golden Cross mode it's the same idea, just with both your short and long MA locked in. The tool optimizes only the exits, leaving your signal untouched.
This is a deliberate design choice. The tool never second-guesses which MA you should use — that's your call, based on your conviction. The tool's job is to size risk around it.
What You See
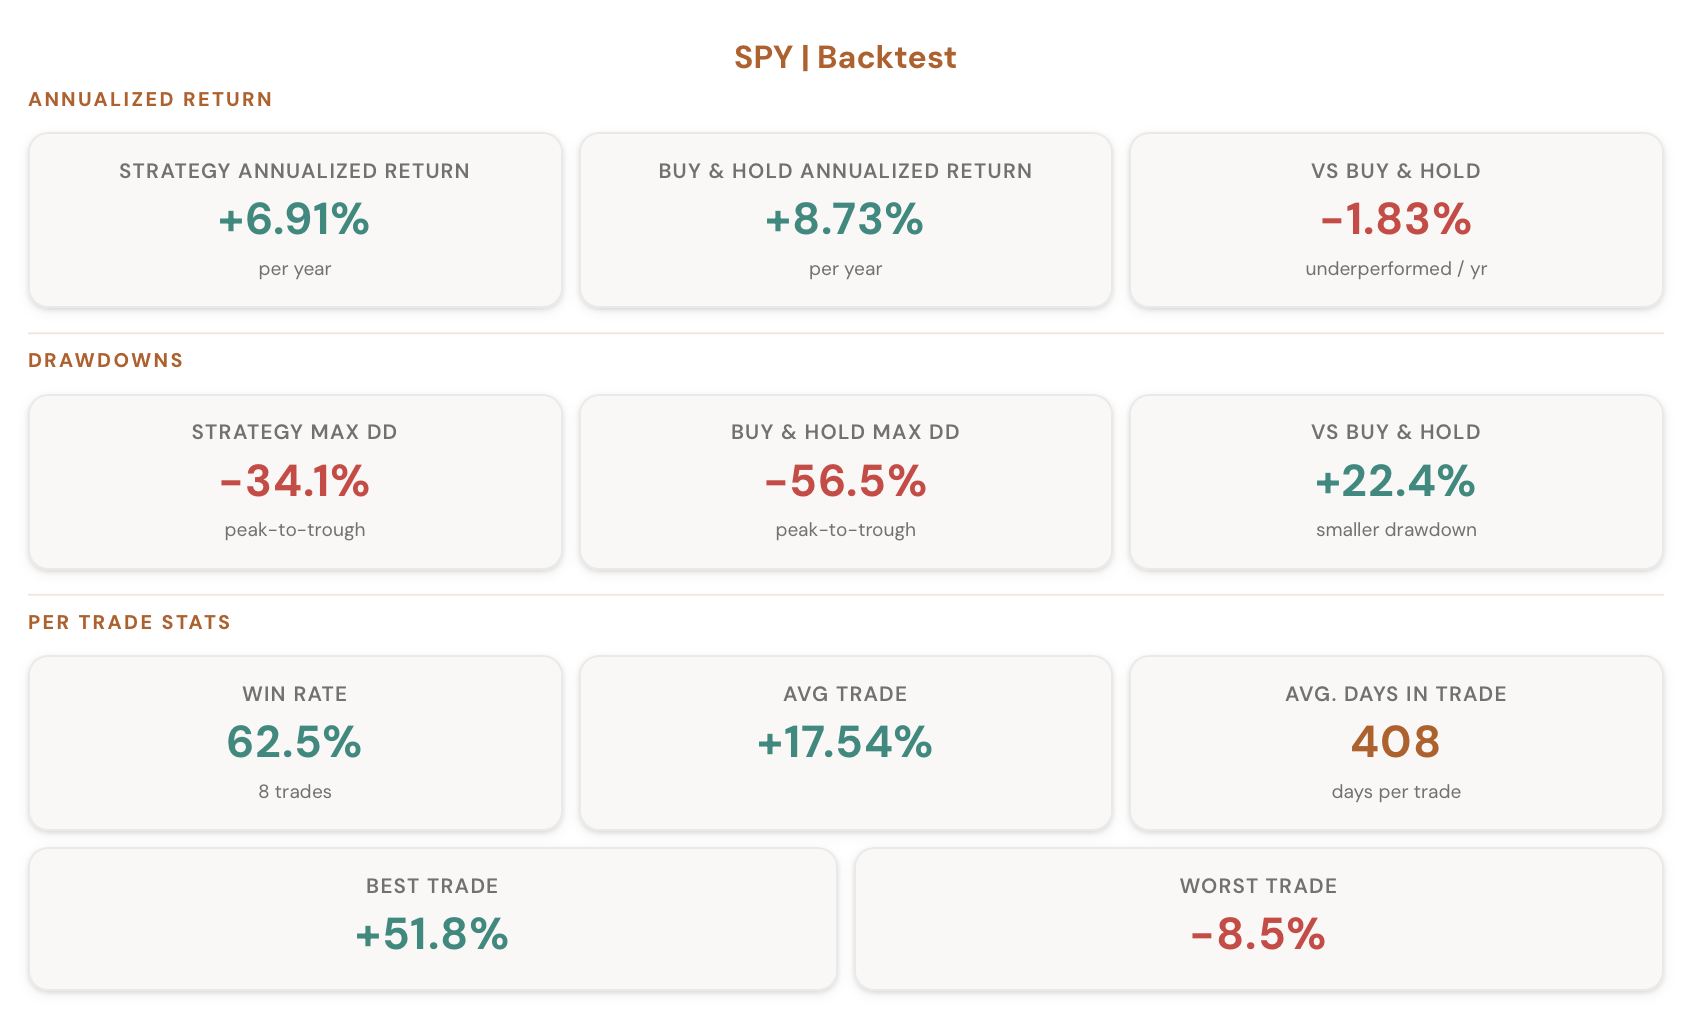
Annualized Return vs Buy & Hold
Your strategy's CAGR, Buy & Hold's CAGR over the same window, and the exact difference. The "vs Buy & Hold" card carries a green checkmark if your strategy won or a red X if Buy & Hold won — no ambiguity.
Per-Trade Stats
Win rate, average trade return, average days in trade, best trade, worst trade. TP/SL exits generally produce shorter hold times and more trades than MA-based exits — which is the point. You're locking in winners and cutting losers fast, not letting trends round-trip.
Drawdowns
Your strategy's worst peak-to-trough drop compared to Buy & Hold's. A 5% stop loss keeps individual-trade damage small, but the cumulative drawdown over many trades can still add up — this card shows you exactly how deep it got.
Equity Curve + Trade Log
An interactive equity curve plots your $10,000 against Buy & Hold over the full history. Zoom to the last year with one click. The trade log lists every entry, exit, and return — hundreds of rows of real backtest data you can scan or export.
Why This Matters
The old tool tested "does this moving average system work?" — a question nobody in trading actually asks anymore. The new tool tests "if I take this specific trade with these specific exits, what's the distribution of historical outcomes?" — which is the question every trader needs answered before clicking buy.
Say MSFT closes above its 200-day MA today. You want to buy. What should your profit target be? What's a historically reasonable stop? Pick MA=200, click Find Best Combination for Selected MA, and you'll have an answer in under two seconds. Same MA, same data, same signal — but now the tool gives you an answer you can actually act on.
Comments
Loading comments…