The MA Positioning tool auto-detects how stretched any ticker is from its 5, 10, 20, 50, and 200-day moving averages, finds every prior day that matched the same pattern, and classifies the next-day distribution as BUY, NEUTRAL, or SELL.
A single moving average tells you one thing about a stock. Five moving averages, taken together, tell you something more useful: where the price sits across every meaningful timescale at once. A stock that's 1% above its 5-day MA, 2% above its 20-day, and 8% above its 200-day is in a different regime than one that's 1% above the 5-day but below every longer MA. Most retail tools collapse that into a single number. We don't.
So we built the comparison. Pick a ticker. The tool reads off how far the current price sits from each standard MA (5, 10, 20, 50, 200) and finds every prior trading day where the same MA-distance pattern was at least as extended. From that matching set it computes the next-day return distribution, then classifies the result on a simple scale: STRONG BUY, BUY, NEUTRAL, SELL, STRONG SELL. One verdict, backed by every analog day in the historical record.
The MA Positioning tool is the answer to "where does this stock actually sit, and what usually happens next" without the chart-pattern guessing.
Pick a ticker from the pills (SPY, QQQ, IWM, AAPL, NVDA, TSLA, PLTR are pre-loaded; the More dropdown adds AMD, AMZN, GLD, GOOGL, META, MSFT, NFLX, SLV; or type any symbol). The Parameters sidebar surfaces two controls: Tomorrow's Forecast / Today's Forecast (anchor on today's close to forecast tomorrow, or yesterday's close to forecast today's intraday move) and the Distance from MAs preset row showing the ticker's current % distance next to each MA along with an All MAs button that requires every MA to clear the bar simultaneously.
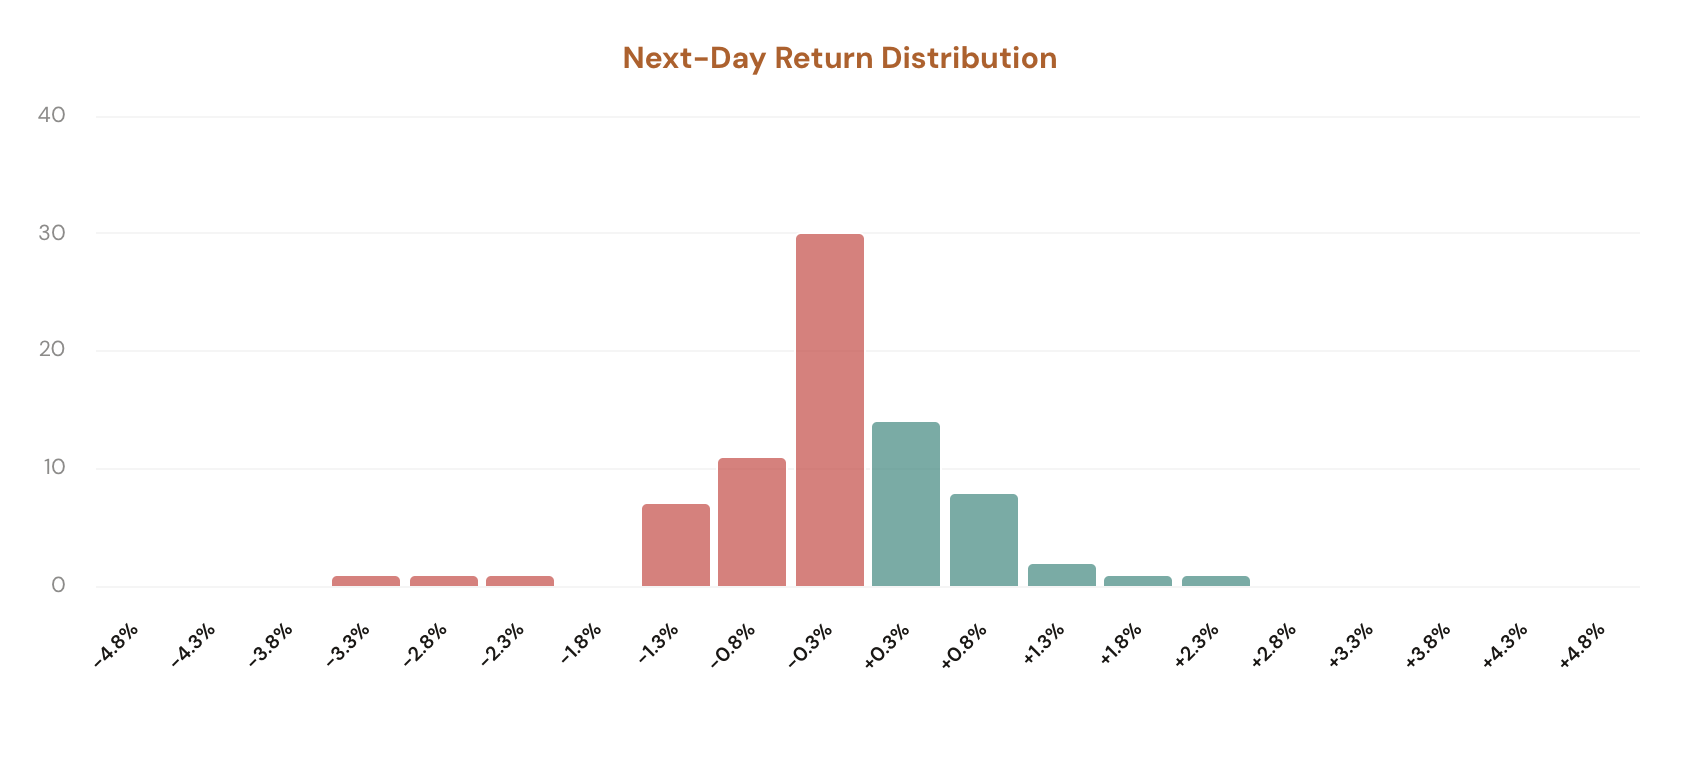
The main panel returns a BUY / NEUTRAL / SELL signal pill at the top, then standard stat cards (Green Close %, Average Return, sample size), a next-day return distribution chart, and a collapsible occurrences log listing every historical day that matched the pattern.
An auto-detected MA-distance snapshot, six preset filters, a verdict pill, two stat cards, a return distribution, and a per-day occurrences log.
The Distance from MAs row reads off the ticker's current % distance from its 5-day, 10-day, 20-day, 50-day, and 200-day SMAs. No filters to dial. The numbers update with the latest close on every page load.
Click any single-MA preset (5, 10, 20, 50, 200) to find every historical day that MA was at least as extended as today. Click All MAs for the strictest scan: every MA must clear the bar at the same time. The default is All MAs.
A pinned signal pill at the top of the results gives you the one-word read: STRONG BUY, BUY, NEUTRAL, SELL, STRONG SELL. Computed from the next-day win rate and average return across the matching set, with the coin-flip zone (45–55%) classified as NEUTRAL.
Switch between forecasting tomorrow's close-to-close return (anchor: today's close) and today's open-to-close intraday return (anchor: yesterday's close). Same MA-distance match, different forward window. Same toggle pattern as the other forecasting tools.
Two numbers off the matching set: the share of similar historical days that closed higher the next session, and the mean close-to-close return across the same sample. Plus the historical sample size so you know how thin or deep the read is.
A return distribution chart bins the next-day returns from every match so you can see whether outcomes cluster tight or spread heavy-tailed. Below it, a collapsible occurrences log lists every match by date with its MA distances, sample stats, and forward return.
MA Positioning has fewer knobs than the backtest tools by design. The MA-distance snapshot is auto-detected from live data, the matching logic is deterministic, and the only real knob is which subset of MAs you want to scan against. The point is to surface a fast, defensible verdict, not let you over-fit a strategy.
Pick a single MA when you have a specific timeframe in mind. The 5-day MA fires on swing-trader timescales (a stretch above the 5-day means the last week has been one-sided). The 200-day fires on regime-change timescales (a deep stretch above the 200 is a real cyclical bull signal). Each preset shows you the ticker's exact current distance from that MA so you can see what level of extension is being matched.
The strictest scan. A historical day only counts if every standard MA (5, 10, 20, 50, 200) was at least as extended as today. This is much rarer than any single-MA match, but every hit represents a stock that was extended on every timescale simultaneously. If the All MAs scan returns zero matches, the tool auto-widens through subsets ([5,10,20,50] then [5,10,20] then [5,10] then [5] then [10]) and stops at the first rung that produces at least one match. The preset buttons re-highlight to show which MAs ended up driving the sample.
Tomorrow's Forecast uses today's close as the anchor and reads the next session's close-to-close return on every match. Today's Forecast uses yesterday's close as the anchor and reads today's open-to-close return on every match. The first answers "if I hold overnight, what happens?" The second answers "if I take an intraday position at the open right now, what happens?" Same data, different window.
Five workflows that lean on the multi-MA positioning read.
Paste a ticker. Read the verdict pill. If it's STRONG SELL, the historical analogs to the current MA-distance pattern faded the next day. If it's STRONG BUY, they extended. Coin-flip results show as NEUTRAL so you don't over-read noise. One pass, one decision.
Click 5 MA, then 50 MA, then 200 MA, then All MAs. Each preset re-runs the historical match against a different scope. A ticker can be STRONG SELL on the 5-day cross and BUY on the 200-day cross. Knowing which timescale your trade lives on tells you which read to trust.
An All MAs scan that drops to a small subset (e.g. only 5 MA matched) means the ticker's current configuration is historically rare. Every analog matters. A scan that produces hundreds of matches at the All MAs level means today's setup is well-trodden. The verdict's confidence rises with sample size.
Switch the toggle and watch the verdict change. Some tickers extend overnight but fade intraday, or vice versa. The Tomorrow's vs Today's toggle gives you both reads from the same MA-distance setup so you can size each separately.
A STRONG BUY verdict on 8 matches is noise. The same verdict on 80 matches is signal. Open the occurrences log and scan the dates. If the verdict is propped up by a cluster of 2020 days and the rest are flat, the headline is misleading and the log makes that obvious.
MA Positioning is available in your dashboard under Forecasting Tools. CI Volatility members see the full Distance from MAs presets, BUY / NEUTRAL / SELL verdict, distribution chart, and occurrences log; free users see a blurred preview with a sign-up prompt.
Open MA Positioning
Comments
Loading comments…