The Lab
January 12, 2026

Your stock just gapped.
Does it fill, or run?

The Opening Gaps tool auto-detects today's gap on any ticker, finds every historical day with a similar gap, and shows you what happened next: intraday direction, gap fill timing, distribution, and the full occurrences log.

"AAPL gapped up 1.2% on the open" is the kind of tape note that lands every morning across a thousand desks. The instinct is always the same: do I fade it because gaps fill, or do I chase it because gaps run? Both camps are loud, both can quote a chart pattern, and almost nobody who quotes either one has actually counted what happens next on the ticker they're trading.

So we built the count. Pick a ticker. The tool auto-reads today's actual gap from the live data and finds every prior trading day where the same ticker gapped a similar amount in the same direction. From that matching set it computes the intraday-direction stats, the gap-fill rate and timing, a return distribution, and a per-occurrence log so you can audit every match by date.

The Opening Gaps tool is the answer to "fill or run" without the chart-pattern hand-waving.

Opening Gaps tool showing the Today's Gap auto-detection, Gap % stepper, VIX Regime filter, the Intraday Stats and Gap Fill Timing stat rows, the per-occurrence log with date / prev close / open / close / VIX / gap % / open-to-close columns, and the next-day return distribution chart

Pick a ticker from the pills (SPY, QQQ, IWM, AAPL, NVDA, TSLA, PLTR are pre-loaded; the More dropdown adds AMD, AMZN, GLD, GOOGL, META, MSFT, NFLX, SLV; or type any symbol). The hero card shows two controls: Gap % (auto-set to today's actual gap, with a stepper to test alternative values like +0.5% or -2%) and VIX Regime (No Filter, <20, 20–30, >30). The sidebar mirrors today's gap as a read-only display so you always know what the tool is anchored on.

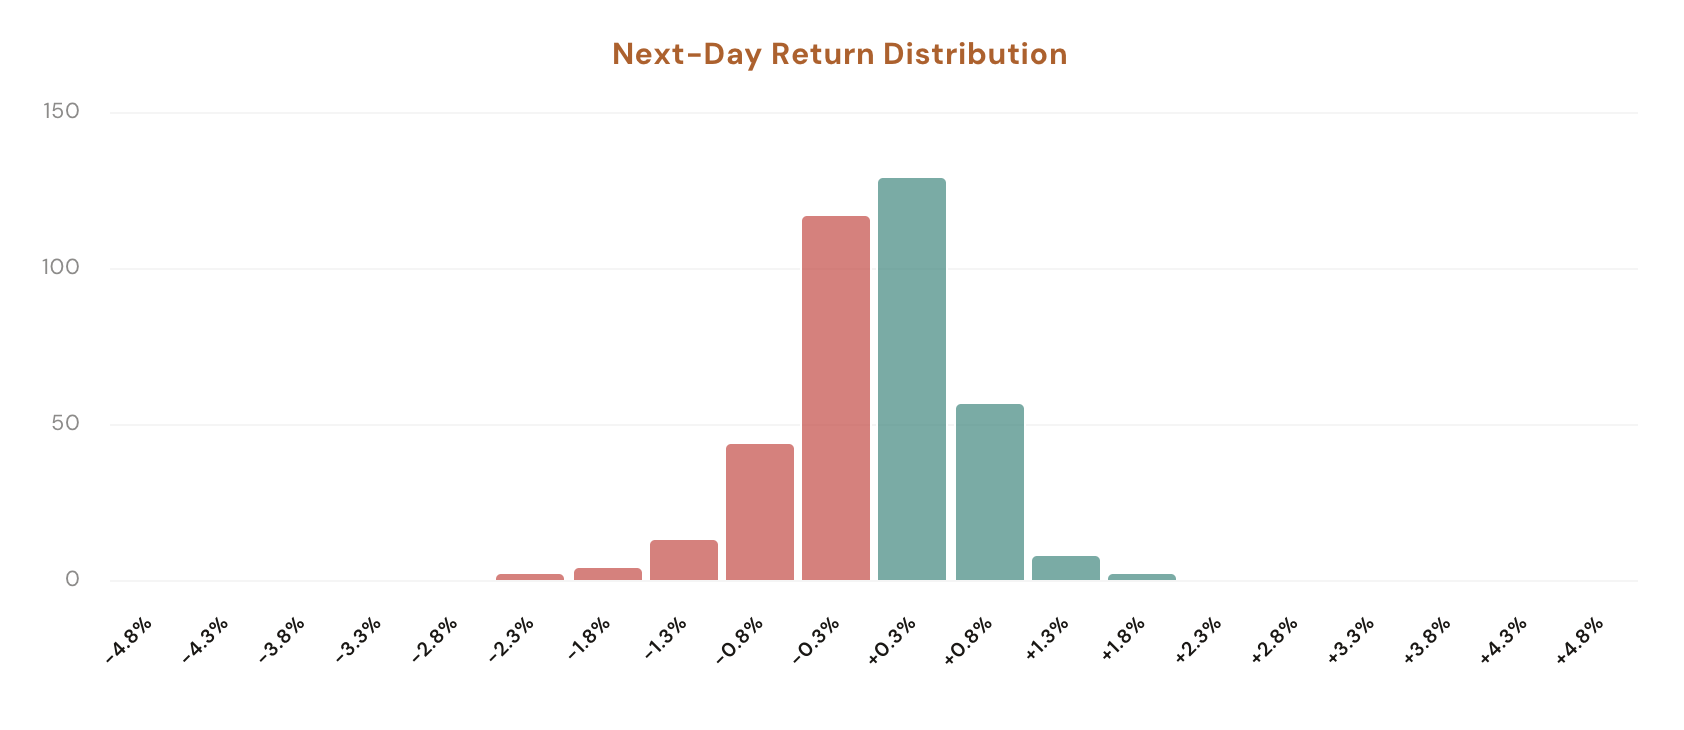
The main panel returns two stat rows: Intraday Stats (what happens between the open and the close on matching days) and Gap Fill Timing (how often, and how quickly, the gap closes back to the prior session's close). Underneath, a collapsible occurrences log lists every matching historical day with its date, prior close, open, close, VIX, gap %, and open-to-close return, plus a distribution chart showing where the open-to-close returns clustered.

What the Tool Shows You

An auto-detected gap, a regime filter, two stat rows, a return distribution, and a per-day occurrences log. Everything anchored on a comparison group of historical days that gapped the same way as today.

Auto-Detect

Today's Gap

The Gap % field auto-populates with the ticker's actual current-session gap (open vs prior close). No filters to dial. Pick a ticker, and the tool snaps to today's real gap and runs the historical match.

Gap Stepper

Test Alternative Gaps

The stepper lets you nudge the target gap up or down (with a sign for direction) to ask hypothetical questions: "What if AAPL gapped +2% instead of +1%?" The tool re-runs the historical match against the new value instantly.

VIX Regime Filter

Calm, Elevated, Crisis Tape

Narrow the matching set to days where VIX at the 9:30 AM open was <20 (calm), 20–30 (elevated), or >30 (crisis). A 1% gap in a quiet VIX-15 environment behaves nothing like a 1% gap when VIX is north of 30. Filtering by regime keeps the comparison honest.

Intraday Stats

Open to Close Behavior

Stat cards summarizing the matching set's open-to-close direction: how often price closed above the open, the average open-to-close return, and how the matches split between continuation and fade outcomes.

Gap Fill Timing

How Often, How Fast

Stat cards measuring whether and when the gap actually fills back to the prior session's close. Includes the fill rate, the average time-to-fill in minutes, and the share of days where the gap stayed open all day.

Audit

Occurrences Log + Distribution

A collapsible per-day log lists every historical match with date, prev close, open, close, VIX, gap %, and open-to-close return. Below it, a distribution chart bins the open-to-close returns so you can see whether outcomes cluster tight or spread heavy-tailed.

Why each filter matters

An unfiltered "after a 1% gap" backtest blends every regime the market has ever traded in. Calm 2017, the 2020 vol crisis, the 2022 rate shock, and quiet 2024 ranges all get averaged into one number. The result is technically correct and practically useless. The filters exist so you can ask narrower, more honest questions.

Gap Size and Direction

A small gap (under 0.5%) fills more often than not on most names because regular intraday volatility is enough to cover it. A larger gap (2%+) is a meaningfully different setup: bigger gaps tend to either continue strongly or rip back equally hard. Auto-detection sets the value to today's actual size, but the stepper lets you test scenarios.

VIX Regime

A 1% gap with VIX at 14 is a routine post-earnings or news-driven move that has a very high gap-fill rate on most large caps. The same 1% gap with VIX at 32 is typically inside a stressed tape where price action persists longer. Including both in one sample averages two completely different distributions into a single misleading number.

Auto-Detected Today vs Manual Override

The default workflow is "open the page, read the answer." The auto-detected gap reflects the actual market state right now, so the historical comparison is always anchored on what's actually happening. The manual stepper is for asking what-if questions: useful if you want to know how the read changes when the gap is bigger or smaller.

Both filters compound. A "+1% gap, VIX between 20 and 30" sample on SPY can collapse to a few dozen historical days. Thin, but specific to a setup you actually care about. The occurrences log lets you read every one of them.

How Traders Are Using It

Five workflows that lean on the historical-gap comparison.

1

Decide fade or chase at the open

Your watchlist name just gapped up 1.4%. Open the tool, read the Gap Fill rate plus the open-to-close direction stats. If 70% of similar gaps closed back below the open historically, the fade is the percentage play. If 60% extended higher, the chase is the percentage play. The data picks one direction.

2

Time your entry around the fill

The Gap Fill Timing stats tell you not just whether a gap fills but how fast. If the average time-to-fill is 45 minutes, you have a much different entry plan than if it's 4 hours. Useful for setting realistic intraday limit orders rather than chasing the print.

3

Compare gap behavior across tickers

Click through SPY, QQQ, IWM, NVDA, TSLA after a market-wide gap day. Each ticker has its own gap-fill rate and intraday distribution. SPY tends to fade gaps; high-beta names tend to extend. Pick the ticker whose response profile fits the trade you actually want.

4

Stress-test thin samples with the log

A 70% fill rate on 12 matches is noise. The same rate on 200 matches is signal. Open the occurrences log and scan the dates and outcomes. If the average is propped up by a cluster of 2020 days and the rest are split evenly, the headline number is misleading and the log makes that obvious.

5

Spot regime-shift gaps with the VIX filter

A 2% SPY gap with VIX at 12 means something very different than the same gap with VIX at 28. Switching the VIX Regime filter shows you whether today's gap is closer to a regular-tape twitch or a crisis-tape persistence move. The decision to size up or down often hinges on this read.

Try it on the gap that just printed

Opening Gaps is available in your dashboard under Forecasting Tools. CI Volatility members see the full intraday direction stats, gap fill timing, distribution chart, and full occurrences log; free users see a blurred preview with a sign-up prompt.

Open Opening Gaps

Comments

Loading comments…