The Lab
April 8, 2026

Which Months Are Best (and Worst) for Your Favorite Stock?

Monthly return patterns for any stock. See which months historically deliver gains and which ones consistently drag performance down.

Every investor has a gut feeling about certain months. January feels like a fresh start. September always seems to sell off. But is any of that backed by real numbers for the specific stocks you own?

Seasonality is one of the most talked-about concepts in investing, yet very few people actually measure it for their own holdings. You hear phrases like "sell in May" or "the January effect" repeated endlessly, but rarely with data attached to a specific ticker.

Getting real seasonality data for individual stocks used to mean downloading years of price history and building your own spreadsheets. Most investors never get around to it.

We built something that does it instantly.

The Seasonality Tool

Seasonality Tool showing monthly return patterns across tickers

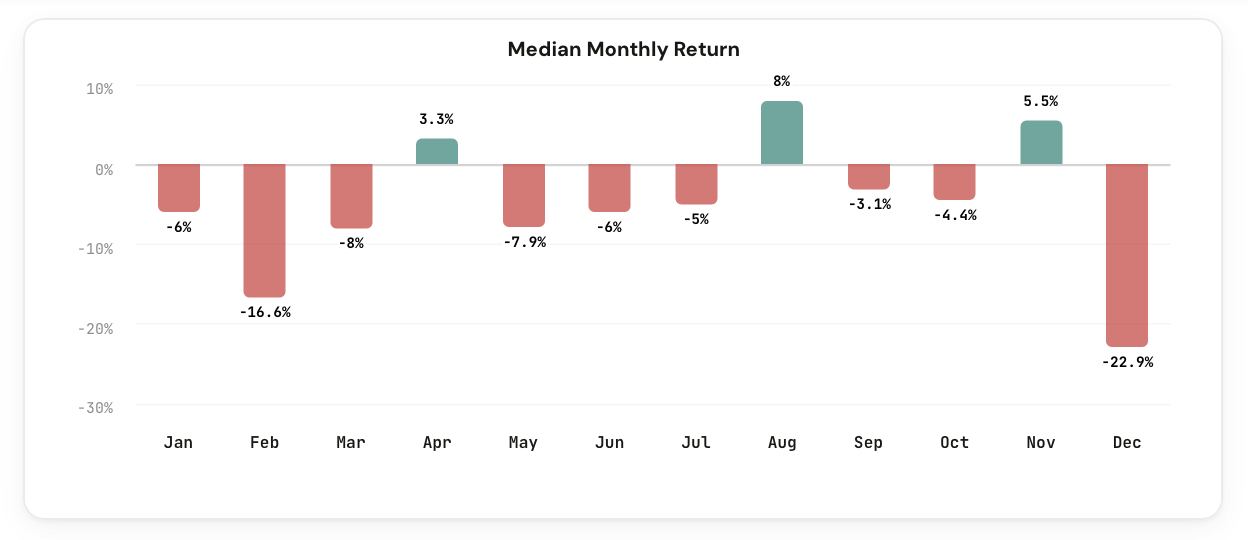
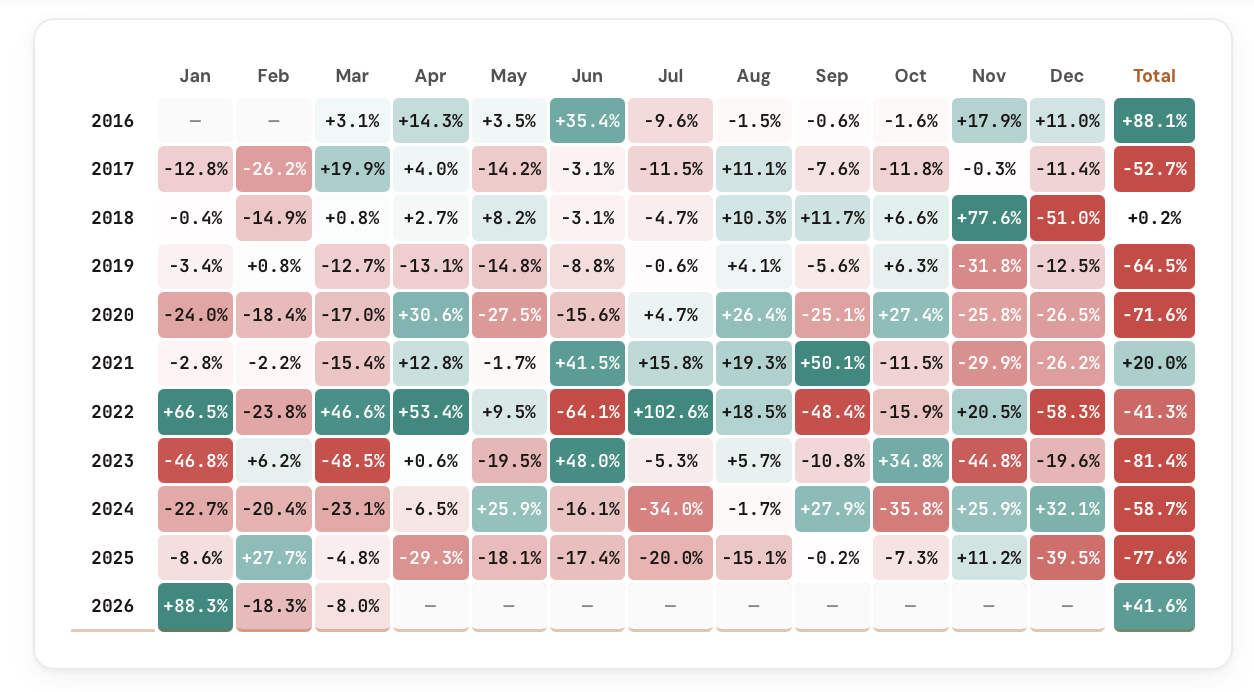
The Seasonality Tool shows monthly return patterns for any stock or ETF. Enter any ticker and you instantly see the median and average return for each month of the year, going back through the full available history.

Type in AAPL and see which months have historically been strongest for Apple. Switch to TSLA and compare whether Tesla follows the same seasonal rhythm or marches to its own beat. Try SPY to see how the broad market behaves month by month.

What the Tool Shows You

Complete monthly return breakdowns for any stock or ETF you want to analyze.

Monthly

Median & Average Returns

See the median and average return for each month, January through December. Toggle between the two to understand typical vs. mean-skewed performance.

Visual

Bar Chart Summary

A clean bar chart showing every month at a glance. Green for positive months, red for negative. Spot seasonal patterns instantly.

Detail

Year-by-Year Breakdown

Switch to Detail view to see every individual year's return for each month. See the range, the outliers, and how consistent the pattern really is.

Coverage

Any Ticker You Want

Built-in tickers for quick access, plus a custom input for any stock or ETF symbol. Type in your favorite holding and get its full seasonal profile in seconds.

Modes

Summary or Detail View

Summary gives you the quick read: median/average per month. Detail gives you the full dataset: every year, every month, every return.

Comparison

Cross-Ticker Patterns

Flip between tickers to compare seasonal patterns. See whether two stocks in the same sector share the same strong and weak months, or if they diverge.

How It Works

Seasonality Tool detail view with yearly breakdowns per month

The tool calculates monthly returns for each ticker across its full available history. For each calendar month, it computes both the median return (the middle outcome, resistant to outliers) and the average return (which captures the full impact of extreme months).

This is the tool you want open when planning entries, exits, or hold periods around calendar effects. If a stock you own historically loses ground in September, that context is worth having before you add to your position in late August.

How Investors Are Using It

Five ways members are applying the Seasonality Tool to their investment process.

1

Entry timing

Identify the historically weakest months for a stock you want to buy. Use seasonal dips as better entry points instead of chasing rallies.

2

Profit-taking windows

Know which months tend to mark seasonal peaks. Consider taking partial profits before historically weak stretches begin.

3

Hold-period planning

If your investment thesis requires holding for several months, check whether those months historically work for or against the stock.

4

Sector comparison

Compare seasonality across stocks in the same industry. Find out if the seasonal pattern is sector-wide or unique to a specific company.

5

Myth-busting

Test common beliefs like "sell in May" or "the Santa Claus rally" against actual monthly return data for the stocks you hold.

The Tool Is Live Now

The Seasonality Tool is available in your dashboard under Premium Tools. If you're a CI Volatility member, you already have access.

Open the Seasonality Tool

Comments

Loading comments…