Pick a vol or inverse ETF and a forward window. The tool reads today's spike level off the running all-time low, finds every prior cycle that started at the same spike, and projects the median, 25th, and 75th percentile price paths forward.
Leveraged and inverse ETFs decay. UVXY, UVIX, VXX, SQQQ, SOXS, SPXU, BOIL: every one of them leaks value over time because of contango on the underlying futures plus the daily-reset rebalancing math. That part is well known. The harder, more useful question is conditional: this ticker has already spiked +47% off its all-time low. How much of that spike has historically melted off in the next 30 days?
A static "average daily decay rate" can't answer that. The decay you'll experience depends on where in the spike cycle you're entering. UVXY at +5% off its ATL behaves very differently from UVXY at +200%. Decay Projection reads where the ticker is right now, walks the full history for every cycle that started at the same spike level, and shows you the actual distribution of what happened next.
Pick a ticker from the 15-ETF universe (UVXY, UVIX, VXX, SQQQ, SOXS, ZSL, BOIL up front; DUST, FAZ, GLL, LABD, SCO, SPXU, TSLQ, TZA in the More dropdown). Set a forward window: either # of Days (default 30 trading days) or By Date (pick a calendar date and the tool counts trading days for you). The tool returns five stat cards and a percentile-band chart.
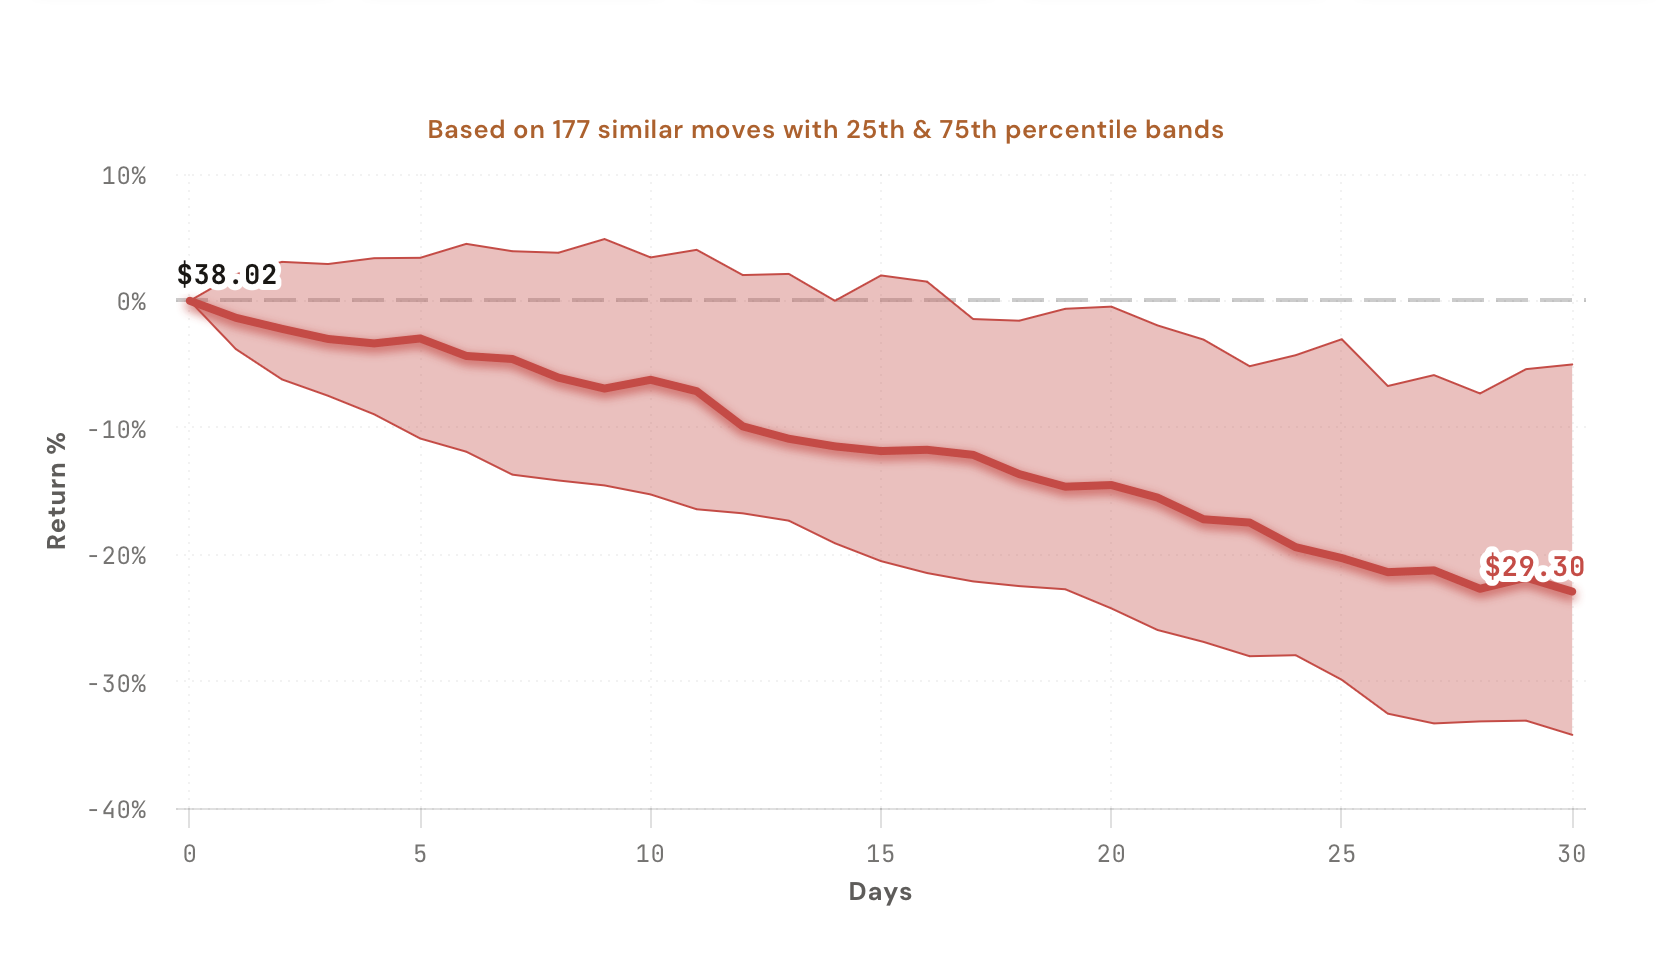
The five cards: Current Price, Projected Price (current × the median historical return at this spike level over your window, colored by direction), Avg Return, Median Return, and Prob. Lower (the percentage of similar past windows that ended below where they started). The chart layers the median price path with a shaded 25th–75th percentile band so you can see both the central tendency AND the realistic spread.
Below the cards an analyst note auto-generates a plain-English read of the projection, including a "watch out" warning when the 75th percentile path goes meaningfully positive (some similar spikes rallied), and a wide-spread warning when the 25–75th band is unusually fat.
Five spike-anchored stat cards, a percentile-band decay chart, and an auto-generated read of the projection.
The tool computes today's spike percentage off the running all-time low and walks history finding every cycle that crossed the same threshold. Each match contributes one forward path. Decay isn't a constant. It depends on where in the spike you are.
Toggle between a fixed trading-day count (30, 60, 90; default 30) or a calendar date picker that counts trading days to your target. Match the projection window to whatever holding period you're actually trading.
Current Price · Projected Price (current × median return) · Avg Return · Median Return · Prob. Lower (% of similar past windows that ended down). Color-coded by direction so the read is instant.
The median price path projected day by day, with a shaded 25th–75th percentile band wrapped around it. Shows you both where the projection lands AND how wide the realistic spread is. Day-zero and end-of-window prices labeled in dollars.
When a ticker is at-or-below its current ATL, there's no recent spike to anchor on. The tool falls back to a Probability-Lab-style read across every overlapping N-day window in the ticker's history, and labels the cards accordingly so you know the baseline shifted.
UVXY, UVIX, VXX, SQQQ, SOXS, ZSL, BOIL up front. DUST, FAZ, GLL, LABD, SCO, SPXU, TSLQ, TZA in the More dropdown. The full set of products where contango plus daily reset compounds into structural decay.
The projection runs as a single bar-by-bar walk over the chosen ticker's full daily history.
If today's spike is 0% (the ticker is at-or-below its ATL right now), there's no recent spike to anchor on. The tool falls back to a Probability-Lab-style analysis: every overlapping N-day window in the full history is one sample. Same chart, same stat cards, just sourced from "all overlapping N-day windows" instead of "post-spike entries." A disclosure on the analyst note explicitly tells you when the fallback fired so the baseline shift is never hidden.
This is the tool to open when you're sizing a position in any of these names, or when you're trying to figure out where to set a stop or a profit target on a structural-decay short.
Five workflows that lean on the spike-anchored projection plus the percentile band.
UVXY just spiked +50% off its ATL and you're considering a short. Set the window to 30 days. If the median says −15% with Prob. Lower at 75% on a 60-match sample, that's a real edge. If Prob. Lower is 55% on 12 matches, sample size is too thin to bet meaningfully.
If the median projected price 30 days out is, say, $14.20 on a current $20.00, that's where the typical "this trade worked" exit lives. Use it as the realistic profit-target anchor instead of guessing a percentage.
The 75th percentile path is the tail risk for a short. If it goes meaningfully positive within the window (even though the median ends lower), that's the analyst-note "watch out" warning fired. Size knowing some similar spikes rallied further before fading.
Run the same window on UVXY, UVIX, VXX, SQQQ, one ticker at a time. Each ticker's spike profile is different, and the median/Prob. Lower numbers diverge. Pick the product whose conditional decay matches the trade you actually want.
If the median decay shows up over 30 days but flattens after that, weekly options aren't enough time and 90-day expirations leak premium without value. Match contract duration to the projection's timing, not your gut.
Decay Projection is in your dashboard under Volatility Tools. CI Volatility members can adjust the forward window and toggle between # of Days and By Date; free users see the default 30-day projection on the default ticker.
Open the Decay Projection Tool
Comments
Loading comments…