Pick a ticker, pick green or red, set the streak length. The Daily Streaks tool tells you how often that streak has happened, the probability it extends another day (and another, and another) and the VIX regime each streak started in.
Three red days in a row. The ticker is down, your screen is red, and the question is whether tomorrow continues the streak or breaks it. Most traders answer that with feel. The Daily Streaks tool answers it with a literal walk through every consecutive-day streak the ticker has ever printed.
For SPY, that's almost a thousand 2-day red streaks across the historical window. The right question to ask isn't "will it bounce." It's a sharper one: given that the streak has now reached N days, what's the historical probability it stretches to N+1? To N+2? To N+5?
Pick a ticker (SPY, QQQ, IWM, AAPL, NVDA, TSLA, PLTR up front; AMD, AMZN, GLD, GOOGL, META, MSFT, NFLX, SLV in the More dropdown). Set Direction to Positive or Negative. Set the Streak Length stepper, or hit Reset to Current Streak to load whatever streak is happening on this ticker right now. Four results cards populate.
The header card tells you how common the streak you're asking about actually is. For "SPY 2-day negative streaks": 965 occurrences · every 9 trading days · last one was 1 trading day ago. That's the baseline frequency: whether you should think of this streak as rare or routine.
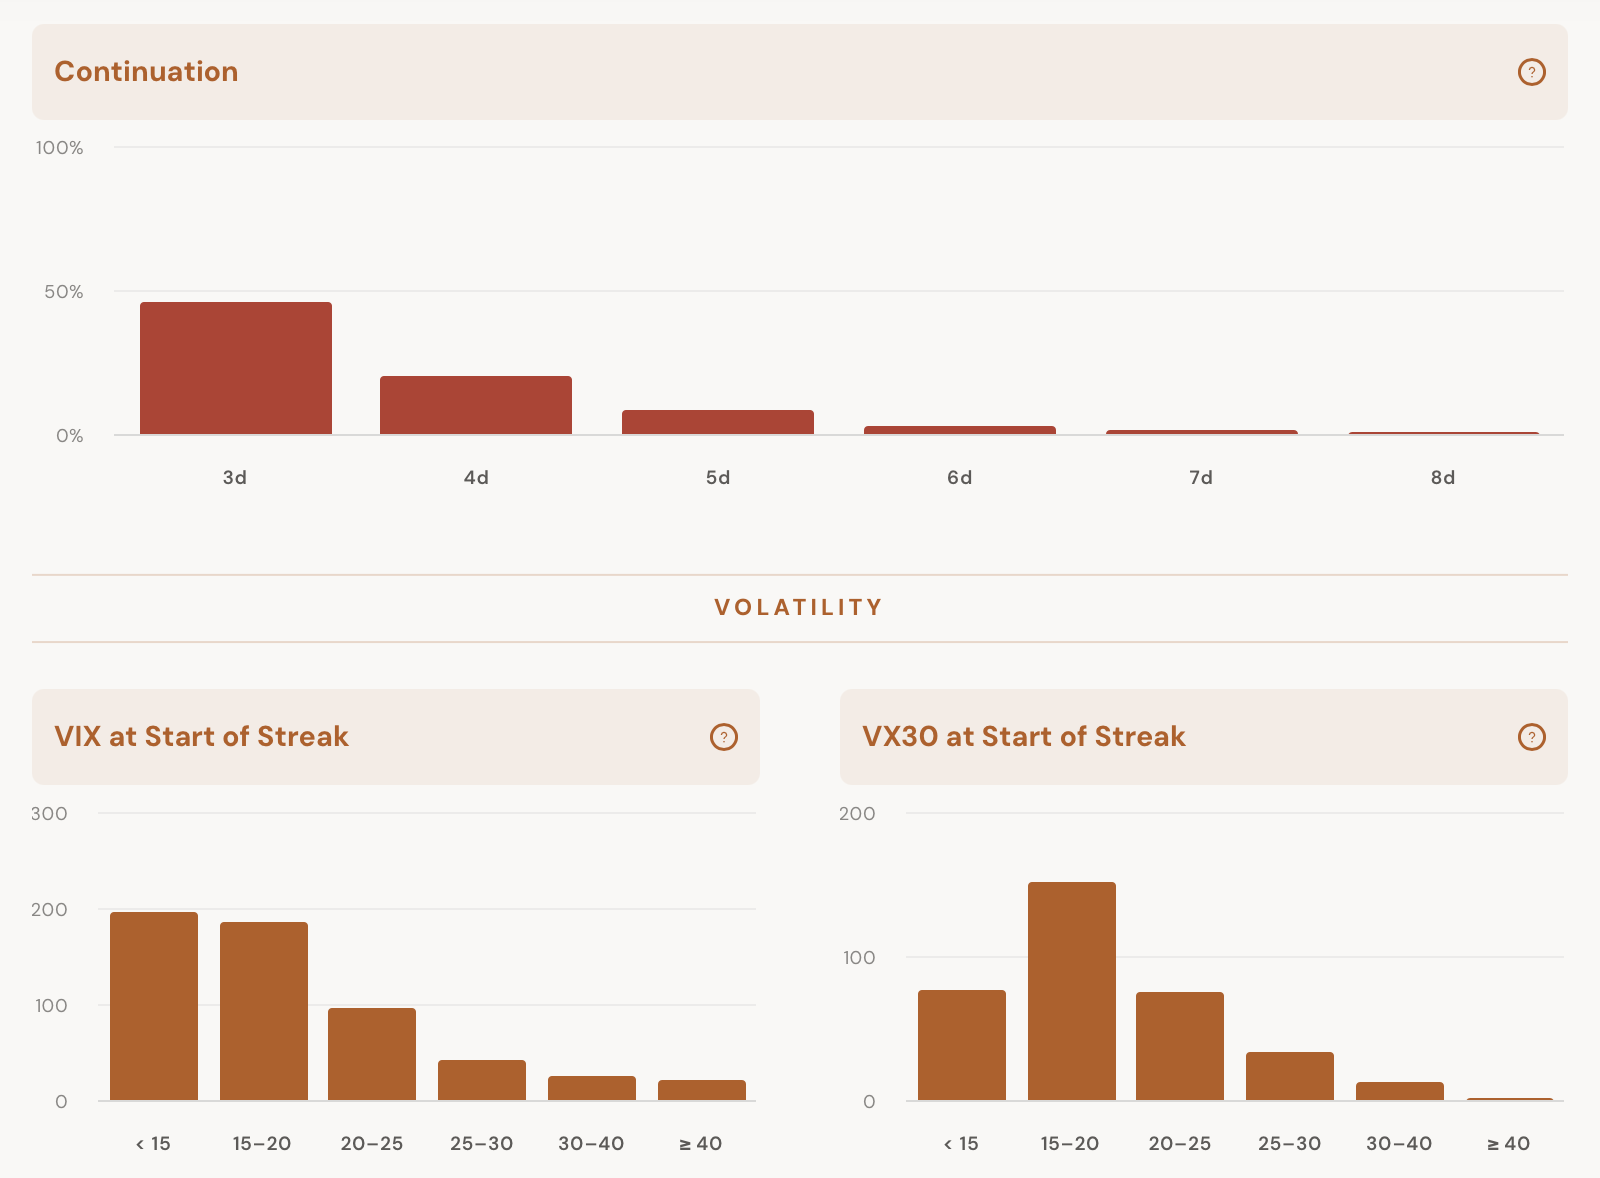
The continuation card is the headline read. It's a stair-step probability: of every 2-day streak that ever happened, 46.0% (443/964) kept going to a 3rd day; 19.1% (184/964) made it to 4 days; 7.2% to 5 days; 2.2% to 6 days; 0.8% to 7; 0.2% to 8. Both numerator and denominator on every row, so you see the actual sample size behind the percentage. That's the real "what happens next" answer: not a forward-return projection, but a clean conditional probability.
The VIX and VX30 at Start of Streak cards show the volatility regime each historical instance started in: a histogram of counts in the <15, 15–20, 20–25, 25–30, 30–40, and ≥40 buckets, plus the average VIX/VX30 across all matches. Lets you check whether the streak you're sitting in is happening in a calm tape (low VIX cluster) or already inside a volatility event.
Below the cards, an expandable event log lists every streak in the ticker's history with date, price at start, VIX at start, VIX at end, and the actual streak length it reached. Useful for sanity-checking the medians or scanning for regime drift. An old streak from 2008 might tell a different story than a 2024 streak even if both fall in the same VIX bucket.
Four result cards, one event log, two interactive controls. Built around the cleanest question to ask of a streak: how often does it extend?
Occurrences, Frequency (e.g. every 9 trading days), and Days Since Last Streak. Tells you whether what you're sitting in is a routine pattern or genuinely rare before you read any further.
For an N-day streak: the historical probability it extended to N+1, N+2, N+3, N+4, N+5, and N+6 days, each as a percent and a numerator/denominator. "2 Days → 3 Days: 46.0% (443/964)". That's a clean conditional probability, not a vague directional guess.
A histogram of counts at six VIX buckets (<15, 15–20, 20–25, 25–30, 30–40, ≥40) plus the average VIX across matches. Shows you whether streaks of this length tend to start in calm tape or already inside a vol spike.
Same six-bucket histogram + average for VX30 (30-day VIX futures index). VX30 captures longer-term volatility expectations, and a divergence between VIX and VX30 at streak start can flag whether the move is stress-driven or routine.
Every historical streak as a row in a collapsible table: date, price at start, VIX at start, VIX at end, and the streak length it actually reached. Lets you sanity-check the median or spot whether one regime is dominating the count.
Toggle Positive / Negative, step the Streak Length input, or hit Reset to Current Streak to load whatever streak is live on this ticker right now. The numbers re-populate instantly.
The build is a single bar-by-bar walk over the ticker's full daily history.
numerator / denominator. Each row gets shown as percent (numerator/denominator) so the sample size is never hidden.The currently-running streak (the one you're sitting in right now) only counts in the denominator if its length already meets the From-Days threshold. If you're 2 days into a streak and asking about 2-day continuations, today's streak is part of the historical sample. If you're asking about 4-day continuations, it isn't yet. The count of 2-day streaks that became 4-day streaks doesn't include trades that aren't done. The math is honest about what's been resolved and what hasn't.
For each streak in the matching set, the tool reads the VIX (and VX30) close on the day the streak FIRST hit From-Days length. It buckets the values into six bands and counts. The average across the bucket is the displayed "Average" number. This isolates the volatility environment that actually produced the streak you're asking about, rather than the unconditional VIX average for the entire dataset.
Five workflows that lean on the continuation probability + regime histogram.
Open the tool, click Reset to Current Streak. The stepper jumps to whatever streak length your ticker is live in right now and the cards re-populate. If SPY is 2 days red, you instantly see how often a 2-day streak has historically become 3, 4, 5 days: the read on the trade you're actually considering.
Continuation probabilities don't fade smoothly. SPY 2-day streaks extend to 3 days about 46% of the time, but only 19% to 4 days, a steep drop. The exact step where probability collapses tells you where the realistic exit lives if you're sizing a streak-fade or a streak-extension trade.
If today's VIX is 14 and you're trying to read a 3-day red streak, look at the VIX-at-start histogram. If 80% of historical 3-day streaks started with VIX above 20, today's calm-tape streak isn't really comparable to the population. You're in a thin sub-sample of the data.
Run the same streak length on SPY, QQQ, IWM, NVDA, TSLA. Continuation profiles diverge sharply. High-momentum names have heavier upper tails (4-day, 5-day extensions) than mean-reverting indices. Pick the ticker whose continuation profile fits the trade you actually want.
A 46% continuation rate on 50 streaks is a different read than the same rate on 950 streaks. The event log shows you the actual list. Scan the dates: if the matches cluster in 2008 and 2020, you may be reading a stress-regime signal, not a baseline one.
Open Daily Streaks, pick your ticker, hit Reset to Current Streak. The continuation ladder, the volatility histogram, and the full event log populate in one click.
Open Daily Streaks
Comments
Loading comments…