The Lab
January 4, 2026

Buy the open, sell the same close. Which weekday pays the most intraday?

Intraday Trading walks 20+ years of bars on any ticker, buys at one weekday's open, sells at that very same day's close, and reports the win rate, average trade, and the largest winner and loser the strategy ever touched.

Intraday traders argue endlessly about which weekday actually trades clean. Some swear by Monday open-to-close; others say Tuesday is the only day with any reliable directional drift; a handful claim Friday is a graveyard you should sit out. None of them have run the numbers on the ticker they're trading. We did.

Pick a ticker. Pick a weekday to enter. The tool walks every bar in the historical record, simulates the buy-at-the-open / sell-at-the-same-close trade, and shows you four numbers and a per-trade audit log. A five-bar chart underneath compares the average per-trade return for every weekday side by side, so you can see whether Wednesday's intraday session beats Friday's at a glance.

The Intraday Trading tool answers "which weekday's session pays" without the hand-waving.

The screenshot says it all

Intraday Trading showing the weekday selector, VIX regime and Moving Average filters, four stat cards (Win Rate, Avg Trade, Best Trade, Worst Trade), the trade log, and the average return by weekday bar chart

Pick a ticker from the pills (SPY, QQQ, IWM, AAPL, NVDA, TSLA, PLTR are pre-loaded; the More dropdown adds AMD, AMZN, GLD, GOOGL, META, MSFT, NFLX, SLV; or type any symbol). The Parameters sidebar gives you three controls: Day (Mon–Fri to choose the entry weekday), VIX Regime (No Filter, <20, 20–30, >30), and Moving Average (No Filter, <5D, >5D).

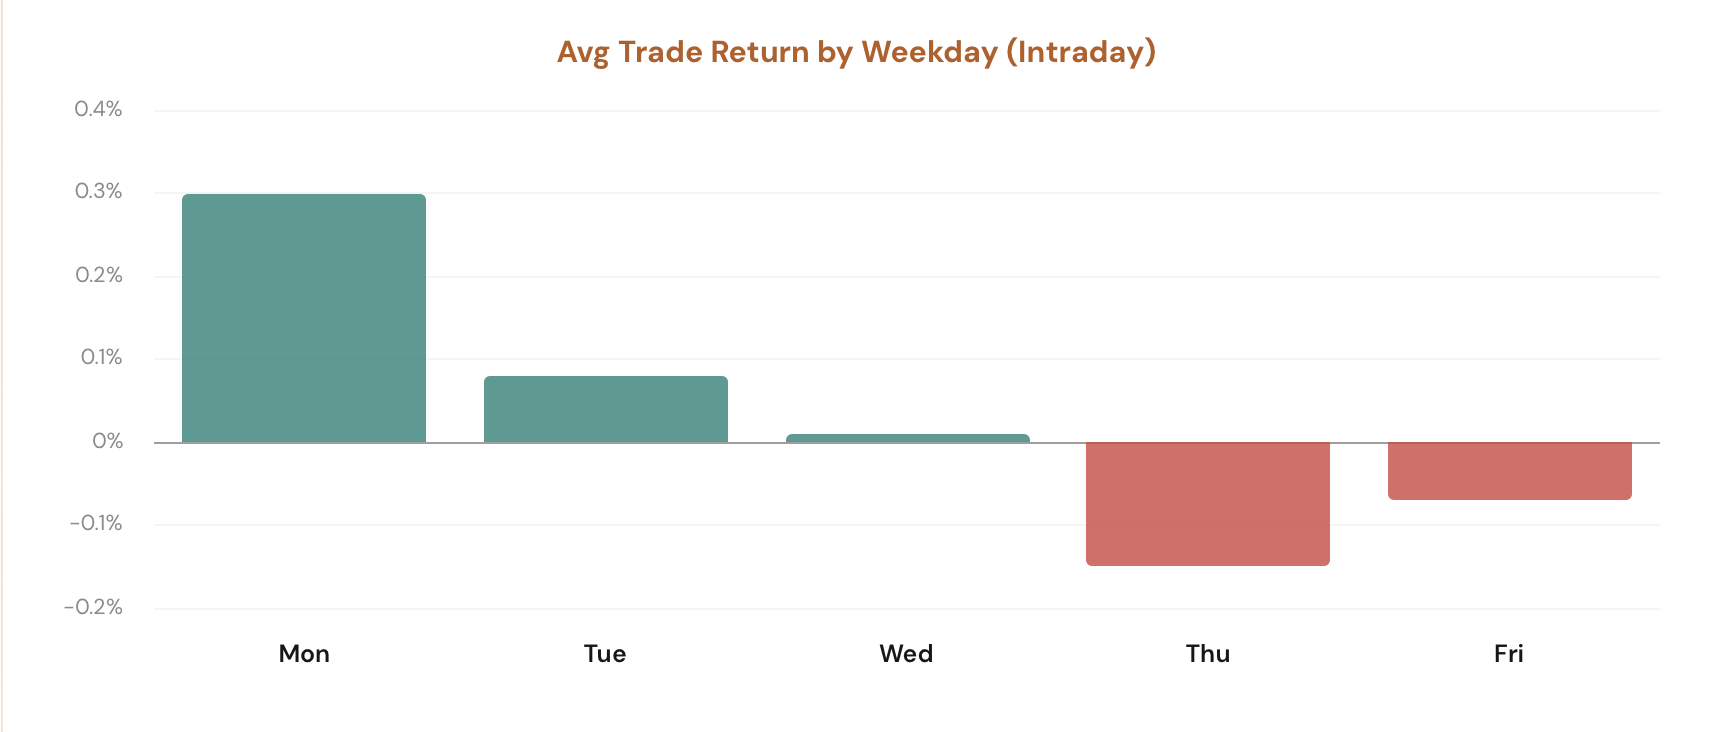
The main panel returns the four stat cards plus a collapsible trade log listing every individual trade by entry date, entry price, exit date, exit price, and return. Underneath, the Avg Trade Return by Weekday chart breaks the same backtest out across all five weekdays so you can compare which entry day historically held the edge.

What the Tool Shows You

Four stat cards, a five-bar weekday comparison, and a per-trade log, all running over 20+ years of bars on whichever ticker you load.

Day Selector

Mon–Fri Entry

Click a weekday to set the entry. Every trade then enters at that day's 9:30 AM open and exits at the same day's 4:00 PM close. No overnight risk and no carry, just the regular session window for whichever weekday you pick.

Stat Cards

Win Rate, Avg Trade, Best, Worst

Four numbers off the matched sample: the % of trades that finished green, the average trade return (winners and losers blended), the largest single-trade gain, and the largest single-trade loss. Hover any card for the exact filter context that built the sample.

VIX Regime Filter

Calm, Elevated, Crisis Tape

Narrow the backtest to only days where VIX was <20 (calm), 20–30 (elevated), or >30 (crisis). Intraday drift in a VIX-15 environment looks nothing like the chop you get when VIX is north of 30. Picking a regime keeps the comparison honest.

Moving Average Filter

5-Day MA Position

Filter to days where the entry open was below the 5-day MA (mean-reversion setup) or above it (continuation setup). Open-to-close returns above the MA tend to behave very differently from open-to-close returns below it.

Find Best Day

Auto-Scan Mon–Fri

One click. The button runs the backtest five times under your current VIX/MA filters (one per weekday) and snaps the Day toggle to whichever weekday produced the highest average trade return (with a 5-trade minimum so a single fluke can't win).

Weekday Chart

Avg Return by Weekday

A five-bar column chart underneath the results showing the average per-trade intraday return for every weekday. Green bars beat zero, red bars are losers, and the trade count for each bar shows in the hover tooltip so you can spot small samples.

Why the filters matter

An unfiltered intraday backtest blends every regime the market has ever traded in: calm post-2017 drift, the 2020 vol crisis, the 2022 rate-shock tape, and quiet 2024 ranges all get averaged into one number. The result is technically correct and practically useless. The filters exist so you can ask narrower, more honest questions.

VIX Regime

Open-to-close returns scale with implied vol. In calm tape (VIX < 20), intraday ranges are tight and the open-to-close drift can be either direction with low magnitude. In crisis tape (VIX > 30), intraday standard deviations widen dramatically, both wins and losses get larger, and the directional bias can flip outright relative to quiet regimes. Pick a regime and the sample becomes comparable.

5-Day Moving Average

An open above the 5-day MA puts the day in a continuation setup; an open below it is a counter-trend bounce setup. The same is true on the red side. Open-to-close returns after these two setups don't look the same, and rolling them into one average hides the edge in either bucket.

Day-of-Week

There's no folklore-magic to Tuesday vs Wednesday in a vacuum, but the average Monday session opens with a weekend's worth of headline risk priced in, and Friday afternoons tend to drift lighter on volume. The Day toggle is what surfaces those weekday-specific quirks instead of pretending they don't exist.

All three filters compound. A filter combination like "Tuesday open, VIX 20–30, price below 5-day MA" can collapse to a few dozen historical trades. Thin, but specific to a setup you actually care about. The trade log lets you read every one of them.

How Traders Are Using It

Five workflows that lean on the per-weekday intraday backtest.

1

Sizing the open-to-close hold

You want to put on SPY at the 9:30 AM open on a Tuesday. Open the tool, set Day to Tuesday, and read the win rate plus average trade. If 20 years of Tuesday opens in this VIX regime show a 54% green rate and +0.06% average, that's a real read on whether to enter at the bell or wait.

2

Avoiding the wrong weekday

Hit Find Best Day. The tool scans Mon–Fri under your filters and highlights the historical winner. More usefully, it shows you which weekday is the worst: the one where the average trade is most negative. That's the entry day to size down or skip when you're running an intraday strategy systematically.

3

Stress-testing with the worst trade

The Worst Trade card surfaces the single ugliest open-to-close session the strategy ever ate: the COVID crash days, a Fed surprise, an earnings shock that hit at the open. That's the right number to anchor your max-loss assumption. Don't size to the average, size to the tail.

4

Comparing tickers under the same setup

Run the backtest on SPY, then on QQQ, then on a single name like NVDA, all with the same Day + VIX + MA filters. The four stat cards make it trivial to see whether the intraday edge concentrates in indexes or transfers to liquid single names.

5

Auditing the sample with the trade log

A 60% win rate on 12 trades is noise. The same rate on 800 trades is signal. Open the trade log and scan the per-trade returns. If the average is propped up by three monster sessions in March 2020 and the rest are flat, the headline number is misleading and the log makes that obvious.

Try it on the ticker you trade

Intraday Trading is available in your dashboard under Backtesting Tools. CI Volatility members see the full Day, VIX Regime, and Moving Average filters; free users see the tool running on default parameters with the filters locked behind a sign-up prompt.

Open Intraday Trading

Comments

Loading comments…