The Lab
January 6, 2026

Buy the Golden Cross. Does the famous signal pay?

Golden Crosses walks 20+ years of bars on any ticker, enters when the short MA crosses above the long MA, exits at a profit target or stop loss you choose, and reports the win rate, average trade, and the full per-trade log.

The Golden Cross is the most cited bullish signal in retail finance. Every cable-news anchor mentions it the day SPY's 50-day moving average pokes above its 200-day. Twitter erupts. The implication is always the same: this is the moment to buy. But "the most cited" is not the same as "the most profitable," and almost nobody who quotes the signal has actually run it on the ticker they're trading.

So we built the test. Pick a ticker. Pick which Golden Cross you want (5/10, 10/20, 20/50, or 50/200). Set a profit target and a stop loss. The tool walks every bar in the historical record, fires an entry on every short-over-long crossover, exits on whichever happens first (your profit target or stop loss), and shows you the result trade by trade.

The Golden Crosses tool is the answer to "does the famous signal actually pay" without the hand-waving.

The screenshot says it all

Golden Crosses tool showing the Golden Cross preset selector, Profit Target and Stop Loss steppers, five stat cards (Win Rate, Avg Trade, Best Trade, Worst Trade, Avg Days in Trade), the trade log, and the Trade Entries and Exits price chart

Pick a ticker from the pills (SPY, QQQ, IWM, AAPL, NVDA, TSLA, PLTR are pre-loaded; the More dropdown adds AMD, AMZN, GLD, GOOGL, META, MSFT, NFLX, SLV; or type any symbol). The Parameters sidebar gives you three controls: Golden Cross (the MA pair: 5/10, 10/20, 20/50, or 50/200), Profit Target (5–50%, default 10%), and Stop Loss (5–50%, default 5%).

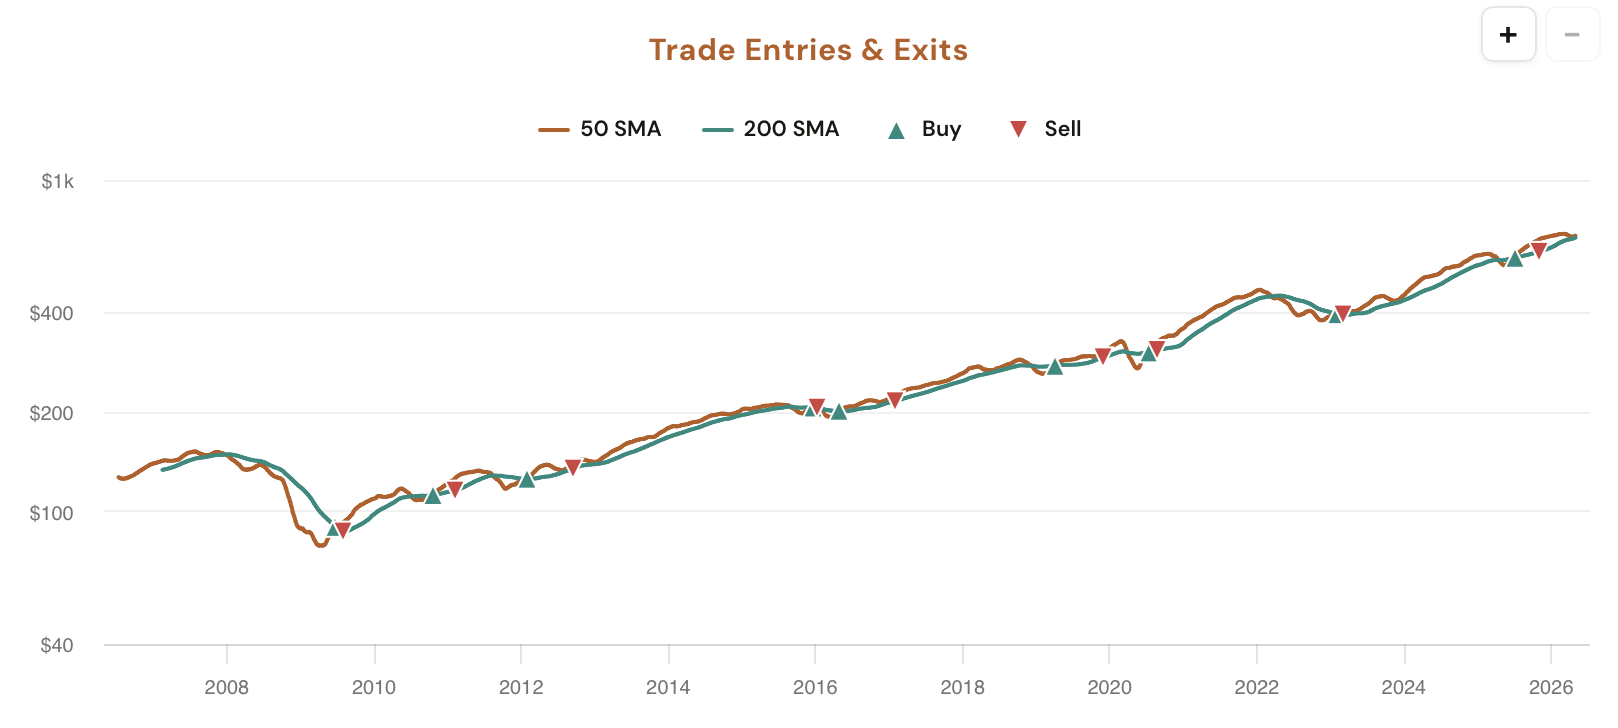
The main panel returns five stat cards plus a collapsible trade log listing every individual trade by entry date, entry price, exit date, exit price, exit reason (target hit or stop hit), and return. Underneath, a Trade Entries & Exits price chart plots every trigger directly on the price line so you can see exactly where the strategy bought and sold across the whole history.

What the Tool Shows You

Five stat cards, a per-trade audit log, and a price chart with every entry and exit marked, all running over 20+ years of bars on whichever ticker you load.

MA Preset

Four Golden Cross Pairs

One click picks the moving-average pair: 5/10 for fast-trigger swing entries, 10/20 for short-cycle holds, 20/50 for medium trend, or the famous 50/200 Golden Cross. Each preset re-runs the backtest end to end on the chosen ticker.

Exit Rules

Profit Target + Stop Loss Steppers

Two steppers (5–50% each). Every position auto-exits at whichever fires first: the profit target above entry or the stop loss below it. Defaults are 10% and 5%, but you can dial them to match the risk:reward you actually trade.

Stat Cards

Win Rate, Avg, Best, Worst, Hold Time

Five numbers off the matched sample: Win Rate, Avg Trade (winners and losers blended), Best Trade, Worst Trade, and Avg Days in Trade. Hover any card for the exact filter context that built the sample.

Per-Trade Log

Every Crossover, Audited

A collapsible table listing every individual trade with entry date, entry price, exit date, exit price, exit reason (target hit, stop hit, or open), and return. Useful for spotting whether the average is propped up by one outlier or sits on a consistent cluster.

Price Chart

Trade Entries & Exits

The full price history with every Golden Cross entry and its corresponding exit plotted directly on the chart. See whether the signal tends to fire in trending tape (clustered crossings) or chop (one-and-done flips), and whether your exits cluster at targets or stops.

Open Positions

Active Trade Tracking

If the most recent Golden Cross hasn't yet closed (no profit target or stop hit), it shows up in the trade log as an open trade with a running unrealized return. Lets you see where the live signal sits relative to your exit thresholds.

Why each parameter matters

The Golden Cross is not a single signal. The headline 50/200 cross fires once or twice a decade on broad indexes; a 5/10 cross fires dozens of times a year on the same ticker. They're not the same strategy and they don't produce the same equity curve. The tool exposes the four most-traded presets so you can compare them on the ticker you actually own.

5 / 10 (fast-trigger)

Two short MAs. Fires often, gets whipsawed often. Win rate tends to be lower per-trade but trades are short, so capital cycles fast. Useful for active swing traders who want frequent triggers and can size around the noise.

10 / 20 (short cycle)

A common compromise: triggers more than once a year on most large caps, holds long enough to capture a real move when one is there. Profit targets in the 8–15% range and stops in the 3–6% range tend to work well historically.

20 / 50 (medium trend)

Slower triggers, longer holds, fewer false starts. Closer to a "real trend has begun" signal. The trade log usually shows fewer entries but a higher average hold time, and the win rate concentrates more around large captured moves.

50 / 200 (the famous one)

The cable-news Golden Cross. Fires rarely on major indexes (sometimes only once or twice across the available history), so the sample size is small and a single regime can dominate the result. Run it on individual stocks and the picture is very different: the signal fires more often and the win rate, profit target hit %, and average trade can diverge sharply from the index version.

Profit Target and Stop Loss compound. A 50/200 cross with a tight 5%/3% target/stop produces a totally different trade log than the same cross with a wide 30%/15% pair. Both are valid; both tell you something different. The tool lets you stress-test which combination historically held an edge on the ticker you trade.

How Traders Are Using It

Five workflows that lean on the Golden Cross backtest with custom exits.

1

Validate the famous 50/200 before you trade it

SPY just printed a 50/200 Golden Cross on the news ticker. Should you act? Open the tool, set Day to SPY's preset, dial your real exits in, and read the historical Win Rate plus Avg Trade. The data either backs the headline or quietly disagrees with it.

2

Compare presets on the same ticker

Click through 5/10, 10/20, 20/50, and 50/200 with the same Profit Target and Stop Loss. The five stat cards make it trivial to see which MA pair has historically held the strongest edge on this specific ticker, and which one trades it like a coin flip.

3

Tune your exit thresholds

Sweep the Profit Target and Stop Loss steppers up and down on a fixed preset. Watch the Win Rate and Avg Trade respond in real time. The combination that maximizes Avg Trade across the historical sample is a solid starting point for the live exits you write into your order ticket.

4

Stress-test with the worst trade

The Worst Trade card surfaces the single ugliest loss the strategy ever took, even with your stop loss in place (sometimes a gap blows past the stop). That's the right number to anchor your max-loss assumption on a single trade. Don't size to the average, size to the tail.

5

Audit the sample with the trade log

A 60% win rate on 8 trades is noise. The same rate on 80 trades is signal. Open the trade log and scan the per-trade returns and dates. If the average is propped up by three monster trends in the early 2010s and the rest are flat, the headline number is misleading and the log makes that obvious.

Try it on the ticker you trade

Golden Crosses is available in your dashboard under Backtesting Tools. CI Volatility members see the full Golden Cross preset, Profit Target, and Stop Loss controls; free users see the tool running on default parameters with the controls locked behind a sign-up prompt.

Open Golden Crosses

Comments

Loading comments…