Death Crosses walks 20+ years of bars on any ticker, opens a short when the short MA crosses below the long MA, exits at a profit target or stop loss you choose, and reports the win rate, average trade, and the full per-trade log.
The Death Cross is the bearish twin of the Golden Cross, and it gets the same cable-news treatment in reverse. Every time SPY's 50-day moving average dips below its 200-day, the chyron reads "DEATH CROSS" in red and the implication is that anyone holding stocks should be running for the exits. The signal sounds ominous; ominous-sounding signals are not the same as profitable ones.
Last time SPY printed a 50/200 Death Cross before the COVID crash, it then bounced 30% in three months. Most reactionary headlines around the signal would have lost money. So we built the test. Pick a ticker. Pick which Death Cross you want (5/10, 10/20, 20/50, or 50/200). Set a profit target and a stop loss. The tool walks every bar in the historical record, fires a short on every short-below-long crossover, exits on whichever happens first (your profit target as a price drop or your stop loss as a price rise), and shows you the result trade by trade.
The Death Crosses tool is the answer to "does the famous sell signal actually pay" without the hand-waving.
Pick a ticker from the pills (SPY, QQQ, IWM, AAPL, NVDA, TSLA, PLTR are pre-loaded; the More dropdown adds AMD, AMZN, GLD, GOOGL, META, MSFT, NFLX, SLV; or type any symbol). The Parameters sidebar gives you three controls: Death Cross (the MA pair: 5/10, 10/20, 20/50, or 50/200), Profit Target (5–50%, default 10%), and Stop Loss (5–50%, default 5%). For a short, the profit target is the % drop below entry that closes the trade green, and the stop loss is the % rise above entry that closes it red.
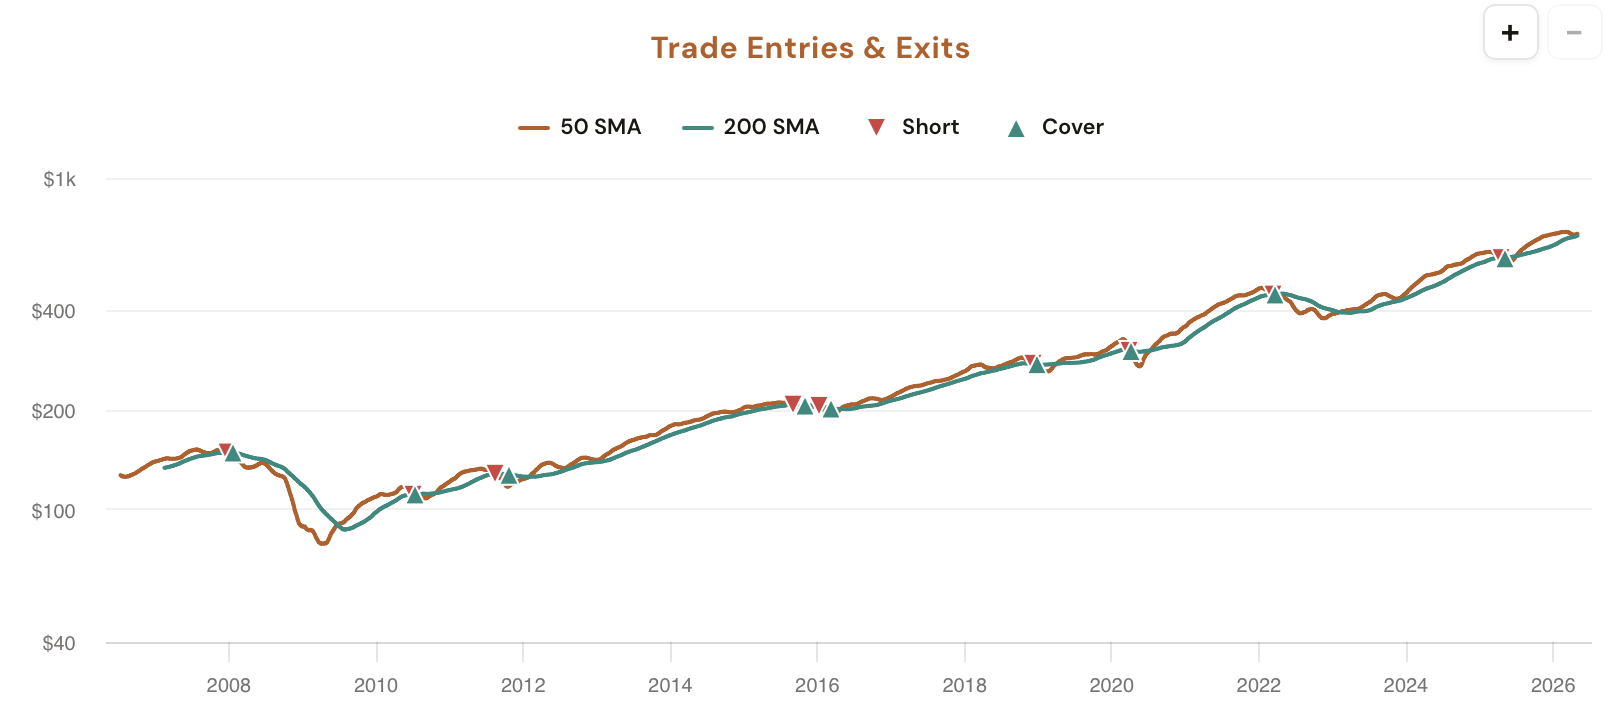
The main panel returns five stat cards plus a collapsible trade log listing every individual short by entry date, entry price, exit date, exit price, exit reason (target hit or stop hit), and return. Underneath, a Trade Entries & Exits price chart plots every trigger directly on the price line so you can see exactly where the strategy went short and covered across the whole history.
Five stat cards, a per-trade audit log, and a price chart with every short entry and cover marked, all running over 20+ years of bars on whichever ticker you load.
One click picks the moving-average pair: 5/10 for fast-trigger short entries, 10/20 for short-cycle bear plays, 20/50 for medium-trend shorts, or the famous 50/200 Death Cross. Each preset re-runs the short backtest end to end on the chosen ticker.
Two steppers (5–50% each). Every short auto-exits at whichever fires first: the profit target as a % drop below entry, or the stop loss as a % rise above entry. Defaults are 10% and 5%, but you can dial them to match the risk:reward you actually trade.
Five numbers off the matched sample: Win Rate, Avg Trade (winners and losers blended), Best Trade, Worst Trade, and Avg Days in Trade. Hover any card for the exact filter context that built the sample.
A collapsible table listing every individual short with entry date, entry price, exit date, exit price, exit reason (target hit, stop hit, or open), and return. Useful for spotting whether the average is propped up by one outlier or sits on a consistent cluster.
The full price history with every Death Cross short entry and its corresponding cover plotted directly on the chart. See whether the signal tends to fire near real tops (clustered crossings before drawdowns) or chops near range extremes that bounce right back.
If the most recent Death Cross hasn't yet closed (no profit target or stop hit), it shows up in the trade log as an open short with a running unrealized return. Lets you see where the live signal sits relative to your exit thresholds.
The Death Cross is not a single signal. The headline 50/200 cross fires once or twice a decade on broad indexes; a 5/10 cross fires dozens of times a year on the same ticker. They're not the same strategy and they don't produce the same equity curve. The tool exposes the four most-traded presets so you can compare them on the ticker you actually want to short.
Two short MAs. Fires often, gets whipsawed often. Win rate tends to be lower per-trade but trades are short, so capital cycles fast. Useful for active swing traders who want frequent short triggers and can size around the noise.
A common compromise: triggers more than once a year on most large caps, holds long enough to capture a real bearish move when one is there. Profit targets in the 8–15% range and stops in the 3–6% range tend to work well historically.
Slower triggers, longer holds, fewer false starts. Closer to a "real downtrend has begun" signal. The trade log usually shows fewer entries but a higher average hold time, and the win rate concentrates more around large captured drops.
The cable-news Death Cross. Fires rarely on major indexes (sometimes only once or twice across the available history), so the sample size is small and a single regime can dominate the result. Run it on individual stocks and the picture is very different: the signal fires more often and the win rate, profit target hit %, and average trade can diverge sharply from the index version.
Profit Target and Stop Loss compound. A 50/200 short with a tight 5%/3% target/stop produces a totally different trade log than the same short with a wide 30%/15% pair. Both are valid; both tell you something different. The tool lets you stress-test which combination historically held an edge on the ticker you trade.
Five workflows that lean on the Death Cross short backtest with custom exits.
SPY just printed a 50/200 Death Cross on the news ticker. Should you short? Open the tool, set the preset, dial your real exits in, and read the historical Win Rate plus Avg Trade. The data either backs the headline or quietly disagrees with it. Often it disagrees.
Click through 5/10, 10/20, 20/50, and 50/200 with the same Profit Target and Stop Loss. The five stat cards make it trivial to see which MA pair has historically held the strongest edge on the short side for this specific ticker, and which one trades it like a coin flip.
Sweep the Profit Target and Stop Loss steppers up and down on a fixed preset. Watch the Win Rate and Avg Trade respond in real time. Shorts have asymmetric risk (unbounded upside loss vs capped downside gain), so picking exits that historically held an edge is more important here than on the long side.
The Worst Trade card surfaces the single ugliest loss the strategy ever took, even with your stop loss in place (a sharp gap up can blow past the stop on a short). That's the right number to anchor your max-loss assumption on a single short. Don't size to the average, size to the tail.
A 60% win rate on 8 short trades is noise. The same rate on 80 trades is signal. Open the trade log and scan the per-trade returns and dates. If the average is propped up by one or two big bear-market crashes and the rest are flat or losing, the headline number is misleading and the log makes that obvious.
Death Crosses is available in your dashboard under Backtesting Tools. CI Volatility members see the full Death Cross preset, Profit Target, and Stop Loss controls; free users see the tool running on default parameters with the controls locked behind a sign-up prompt.
Open Death Crosses
Comments
Loading comments…