The Lab
January 8, 2026

Buy the Bullish MA Close. Does it actually pay?

The Bullish MA Tool scans 20+ years of daily bars on any ticker, enters a long position the first day the price closes above your chosen moving average, exits at the profit target or stop loss you set, and reports the win rate, average return, and complete trading log.

"Price closed above the 50-day MA today" is one of the most common bullish setups retail traders look at. The intuition is straightforward: when a stock can claim a fresh close above a meaningful moving average, momentum has shifted and the buyers have the upper hand. The catch is that almost nobody who quotes the signal has actually run it on the ticker they're holding. Win rate? Average return? Drawdown vs buy and hold? Pure vibes.

So we built the test. Pick a ticker. Pick which MA you want to use as the trigger (anything from 5-day to 200-day). Set a profit target and a stop loss. The tool walks every bar in the historical record, fires an entry on the day price first closes above that MA after being below, exits on whichever happens first (your profit target or stop loss), and shows you the result trade by trade plus the equity curve next to a passive buy-and-hold benchmark.

The Bullish MA Closes tool is the answer to "does the bullish MA-cross signal actually pay" without the hand-waving.

Bullish MA Closes tool showing the Buy Above MA stepper, Profit Target and Stop Loss steppers, MA Alignment filter, five stat cards (Win Rate, Avg Trade, Best Trade, Worst Trade, Avg Days in Trade), the trade log, the equity curve vs buy and hold, and the Trade Entries and Exits price chart

Pick a ticker from the pills (SPY, QQQ, IWM, AAPL, NVDA, TSLA, PLTR are pre-loaded; the More dropdown adds AMD, AMZN, GLD, GOOGL, META, MSFT, NFLX, SLV; or type any symbol). The Parameters sidebar gives you four controls: Buy Above (the MA length, anywhere from 5 to 500 bars), Profit Target (5–50%, default 10%), Stop Loss (5–50%, default 5%), and MA Alignment (No Filter, or Above Longer MAs). A one-click Find Best Moving Average button scans every length from 5 to 200 and snaps the stepper to whichever produced the highest CAGR under your other settings.

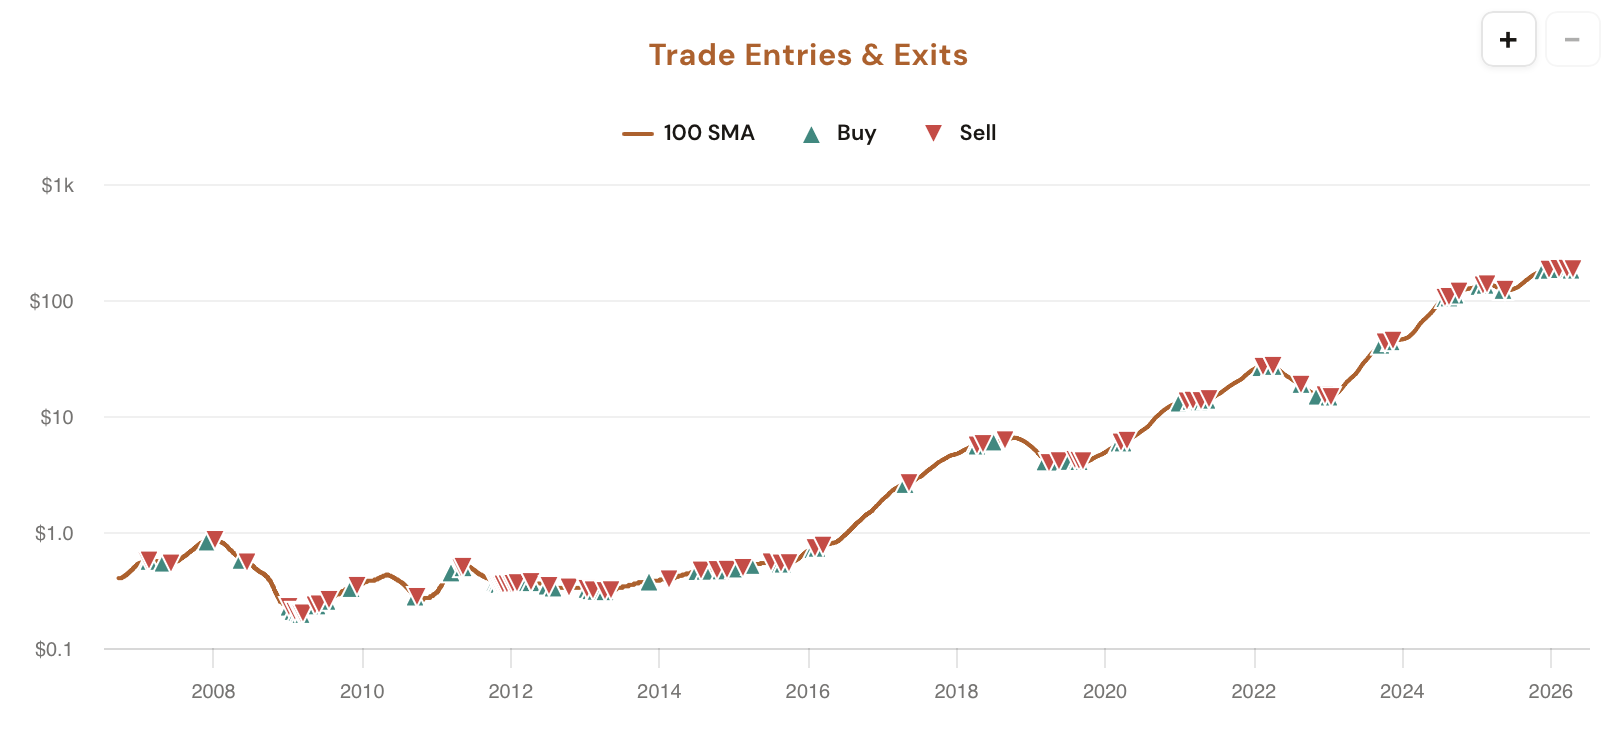
The main panel returns five stat cards plus a collapsible trade log listing every individual trade by entry date, entry price, exit date, exit price, days held, exit reason (target or stop), and return. Underneath, an equity curve compares your strategy's compounded growth to a passive buy-and-hold of the same ticker, and a Trade Entries & Exits price chart plots every trigger directly on the price line so you can see exactly where the strategy bought and sold across the whole history.

What the Tool Shows You

Five stat cards, a per-trade audit log, an equity curve vs buy and hold, and a price chart with every entry and exit marked, all running over 20+ years of bars on whichever ticker you load.

MA Length

Buy Above Stepper (5 to 500)

One stepper picks the moving-average length used for entry. Short (5–20) = fast triggers, lots of noise. Medium (50) = the classic swing-trader MA. Long (100–200) = slow, fewer triggers, only fires inside a real uptrend. The backtest re-runs end to end every time you bump the value.

Exit Rules

Profit Target + Stop Loss Steppers

Two steppers (5–50% each). Every long auto-exits at whichever fires first: the profit target above entry or the stop loss below it. Defaults are 10% and 5%, but you can dial them to match the risk:reward you actually trade.

MA Alignment

Above Longer MAs Filter

Optional filter that only takes a trade when the selected MA is above every longer standard MA (5 > 10 > 20 > 50 > 100 > 200). Stops the strategy from buying a short-term bounce inside a long-term downtrend by requiring the stock to be trending up on every timescale.

Optimize

Find Best Moving Average

One click. The button scans every MA from 5 to 200 under your current Profit Target, Stop Loss, and MA Alignment settings, and snaps the Buy Above stepper to whichever length produced the highest annualized return (CAGR) across the full history.

Stat Cards

Win Rate, Avg, Best, Worst, Hold Time

Five numbers off the matched sample: Win Rate, Avg Trade (winners and losers blended), Best Trade, Worst Trade, and Avg Days in Trade. Hover any card for the exact filter context that built the sample.

Charts + Log

Equity Curve + Trade Map

An equity chart compounds your strategy's per-trade returns and overlays a buy-and-hold curve so you can see at a glance whether you actually beat sitting still. A Trade Entries & Exits price chart plots every signal directly on the price line. The collapsible per-trade log lists every entry / exit / reason / return for full audit.

Why each parameter matters

The MA-cross is not one signal. The 5-day cross fires dozens of times a year on the same ticker; the 200-day cross fires once or twice a decade. The trade logs and win rates from those two are not comparable in any meaningful way. The tool exposes the full range so you can find what actually works on the ticker you own.

Buy Above (MA length)

Shorter MAs trigger faster but get whipsawed by noise. Longer MAs avoid the chop but you give up the early move. The classic 50-day MA is a common sweet spot for swing traders. The 200-day is more of a regime indicator (a close above it means the stock is in a long-term uptrend). Use Find Best Moving Average to let the data pick a length for you.

Profit Target and Stop Loss

Tight exits (e.g. 5%/3%) cycle capital faster but leave a lot of trend on the table. Wide exits (e.g. 25%/12%) ride bigger moves but expose you to deeper drawdowns. The trade log lets you see how often each exit fires, and the equity curve tells you which combination compounds better over the full history.

MA Alignment

A bullish 50-day cross looks great in isolation, but if the 200-day MA is sloping down, the broader trend says the rally is fighting gravity. The Above Longer MAs filter requires the selected MA to be above every standard longer MA before any entry fires. Trade count drops, but the trades that fire are inside a stack of confirming trends.

All four controls compound. A 50-day Buy Above with a 10%/5% target/stop and Alignment turned on produces a totally different trade log than the same MA with no filter. Both are valid; both tell you something different. The tool lets you stress-test which combination historically held an edge on the ticker you trade.

How Traders Are Using It

Five workflows that lean on the bullish MA-close backtest with custom exits.

1

Validate the signal before you act on it

SPY just printed its first close above the 50-day MA in a month. Should you buy? Open the tool, set Buy Above to 50, dial your real exits in, and read the historical Win Rate plus Avg Trade. The data either backs the setup or quietly disagrees with it. Often it disagrees.

2

Let the optimizer pick the MA length

Hit Find Best Moving Average. The tool scans 5 to 200 under your current exits and alignment, and snaps the stepper to whichever length produced the highest annualized return across the full history. Useful for stocks where you don't have a strong prior about which MA the tape respects.

3

Tune your exits against the equity curve

Sweep the Profit Target and Stop Loss steppers up and down on a fixed MA. Watch the equity curve respond in real time and compare it to the buy-and-hold line. The combination where the strategy curve sits highest above the passive line is your historical sweet spot for that ticker.

4

Stress-test with the worst trade

The Worst Trade card surfaces the single ugliest loss the strategy ever took, even with your stop loss in place (a sharp gap can blow past the stop). That's the right number to anchor your max-loss assumption on a single trade. Don't size to the average, size to the tail.

5

Audit the sample with the trade log

A 60% win rate on 8 trades is noise. The same rate on 80 trades is signal. Open the trade log and scan the per-trade dates and returns. If the average is propped up by a few monster trends in the early 2010s and the rest are choppy, the headline number is misleading and the log makes that obvious.

Try it on the ticker you trade

Bullish MA Closes is available in your dashboard under Backtesting Tools. CI Volatility members see the full Buy Above, Profit Target, Stop Loss, and MA Alignment controls plus the Find Best Moving Average optimizer; free users see the tool running on default parameters with the controls locked behind a sign-up prompt.

Open Bullish MA Closes

Comments

Loading comments…