The ATH Backtesting tool scans 20+ years of bars on any ticker, opens a long every time the daily close prints a new all-time high, exits at a profit target or stop loss you choose, and reports the win rate, average trade and full trade log.
"Don't buy at the top" is the most-repeated rule in retail finance, and one of the most misleading. Stocks that print new all-time highs have just done the single most bullish thing a chart can do: closed above every prior close in their history. The "buy low, sell high" instinct says wait. The data says it depends, and "depends" is exactly what a backtest is for.
So we built the test. Pick a ticker. Set a profit target. Set a stop loss. The tool walks every bar in the historical record, fires an entry on every day the close prints a fresh all-time high (and the prior bar didn't), exits on whichever happens first (your profit target or stop loss), and shows you the result trade by trade. An equity curve sits next to a buy-and-hold line so you can see whether chasing the top actually beat sitting still.
The ATH Backtesting tool is the answer to "does buying all-time highs actually pay" without the proverb-quoting.
Pick a ticker from the pills (SPY, QQQ, IWM, AAPL, NVDA, TSLA, PLTR are pre-loaded; the More dropdown adds AMD, AMZN, GLD, GOOGL, META, MSFT, NFLX, SLV; or type any symbol). The Parameters sidebar gives you two controls: Profit Target (5–50%, default 10%) and Stop Loss (5–50%, default 5%). Entry is fixed: every fresh all-time-high close fires a long on the close.
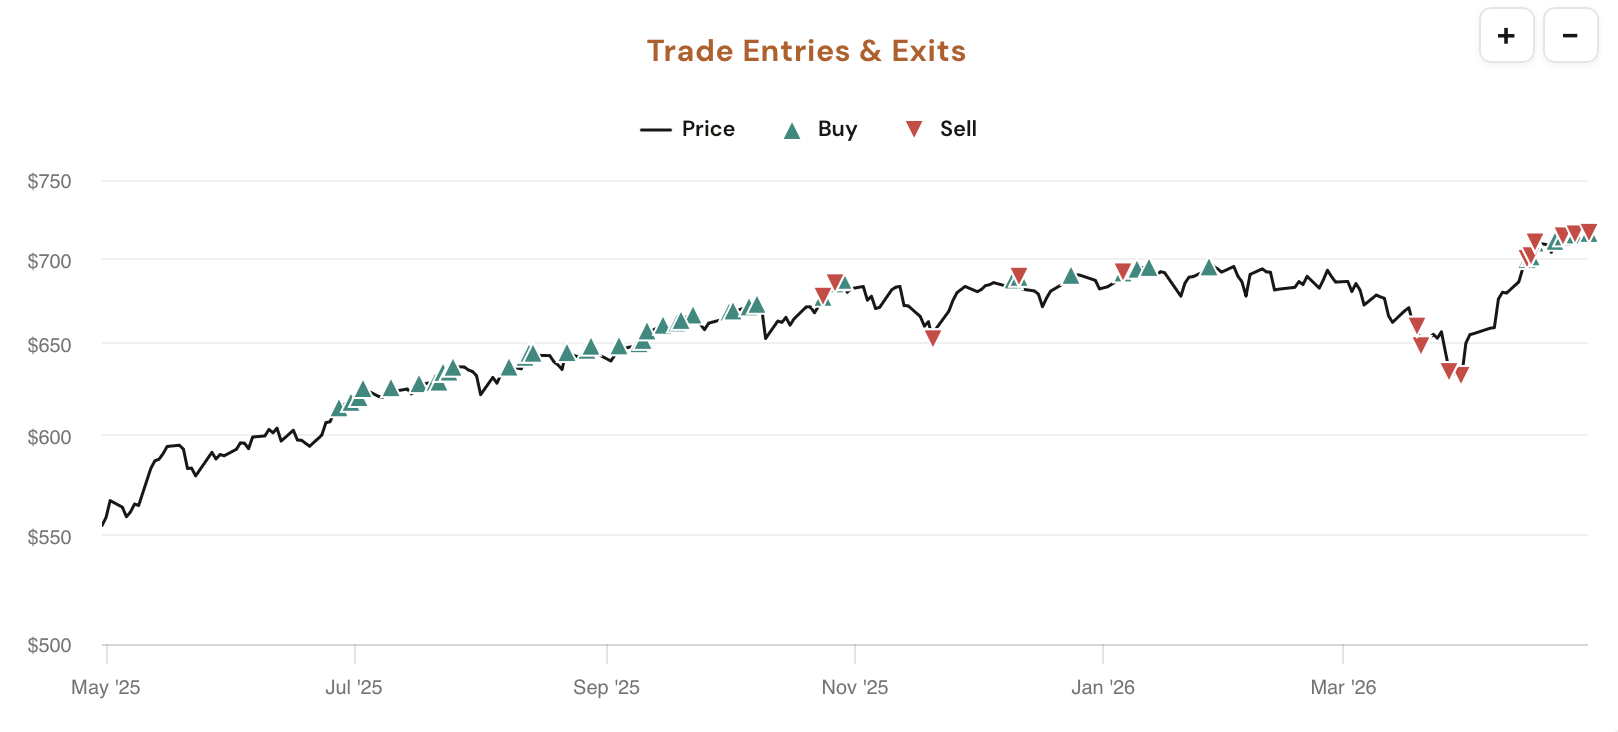
The main panel returns five stat cards plus a collapsible trade log listing every individual ATH-triggered trade by entry date, entry price, exit date, exit price, days held, exit reason (target or stop), and return. Underneath, an equity curve compounds your strategy's per-trade returns and overlays a buy-and-hold curve on the same ticker, and a Trade Entries & Exits price chart plots every ATH trigger directly on the price line.
Five stat cards, a per-trade audit log, an equity curve vs buy and hold, and a price chart with every ATH entry and its corresponding exit marked, all running over 20+ years of bars on whichever ticker you load.
Every entry fires on the daily close that prints a new all-time high (price closes higher than every prior close in the ticker's history). Only the FIRST close of each new ATH leg fires a trade. After a profit target or stop loss exit, the system has to wait for a brand-new ATH to be set before the next entry triggers.
Two steppers (5–50% each). Every long auto-exits at whichever fires first: the profit target above entry or the stop loss below it. Defaults are 10% and 5%, but you can dial them to match the risk:reward you actually trade.
Five numbers off the matched sample: Win Rate, Avg Trade (winners and losers blended), Best Trade, Worst Trade, and Avg Days in Trade. Hover any card for the exact filter context that built the sample.
An equity chart compounds your ATH strategy's per-trade returns and overlays a passive buy-and-hold curve of the same ticker. The gap between the two lines is the only honest answer to "did this beat sitting still?" Same starting capital, same end date, same ticker.
The full price history with every ATH-triggered entry and its corresponding exit plotted directly on the chart. See whether the signal tends to fire in clean trending tape (clusters of new highs) or right at the top before a drawdown, and where your exits actually landed.
A collapsible table listing every individual trade with entry date, entry price, exit date, exit price, days held, exit reason (target hit, stop hit, or open), and return. Useful for spotting whether the average is propped up by one outlier or sits on a consistent cluster.
ATH Backtesting has fewer knobs than the MA-cross tools by design. The entry is fixed: every new all-time-high close. What you control is how the trade closes. Those exit rules are what turn the strategy from "always be long after a fresh high" into something with defined risk and tradeable rules.
Tighter targets (5–8%) cycle capital faster and produce a higher hit rate, but you give up the long uptrends ATH stocks tend to create. Wider targets (15–30%) ride the trend longer at the cost of more open trades sitting around. The trade log lets you see how often the target actually fires vs how often the stop saves the day.
A new ATH is by definition the highest the stock has ever traded, which means there's no overhead supply to trip a quick stop. That makes ATH entries forgiving on the stop side compared to other long strategies. Most of the bad ATH trades come from late-cycle blow-offs where the stock pulls back hard after the top. Wider stops (8–15%) tend to filter out the noise; tighter stops (3–5%) are great in steady tape but get whipsawed in late-stage rallies.
This is the only honest benchmark for any long strategy: would I have done better doing nothing? The equity curve shows compounding returns side by side. On strong trending names, ATH Backtesting often beats buy and hold because the TP/SL exits sidestep the worst drawdowns. On choppy or mean-reverting names, buy and hold typically wins. The chart tells you which kind of name you're running on.
Five workflows that lean on the all-time-high backtest with custom exits.
NVDA just printed a fresh all-time high on the daily close. Should you buy? Open the tool, dial your real exits in, and read the historical Win Rate plus Avg Trade for ATH entries on this ticker. The data either backs the chase or quietly disagrees with it.
Sweep the Profit Target and Stop Loss steppers up and down. Watch the equity curve respond in real time and compare it to the buy-and-hold line. The combination where the strategy curve sits highest above the passive line is your historical sweet spot for that ticker. If the strategy never beats buy-and-hold, that's also a useful read.
Run the backtest on SPY, then on QQQ, then on a single name like AAPL. The five stat cards make it trivial to see whether the ATH edge concentrates in indexes (which trend cleanly) or transfers to single stocks (where blow-off tops matter). Different tickers want different exits.
The Worst Trade card surfaces the single ugliest loss the strategy ever took, even with your stop loss in place (a sharp gap from a blow-off top can blow past the stop). That's the right number to anchor your max-loss assumption on a single ATH-buy trade. Don't size to the average, size to the tail.
A 70% win rate on 12 trades is noise. The same rate on 80 trades is signal. Open the trade log and scan the per-trade dates and returns. If the average is propped up by a cluster of trades during one big bull run and the rest are flat, the headline number is misleading and the log makes that obvious.
ATH Backtesting is available in your dashboard under Backtesting Tools. CI Volatility members see the full Profit Target and Stop Loss controls; free users see the tool running on default parameters with the controls locked behind a sign-up prompt.
Open ATH Backtesting
Comments
Loading comments…