The Lab
January 11, 2026

Buy or short the 52-week low. Bounce or breakdown?

The 52-Week Low Backtesting tool scans 20+ years of bars on any ticker, opens a short every time the daily close prints a new 52-Week Low, exits at a profit target or stop loss you choose, and reports the win rate, average trade and full trade log.

A new 52-week low splits traders into two camps. The trend-followers say the breakdown has just begun and the only sensible play is to short the falling knife. The mean-reverters say capitulation is the bottom and it's the moment to buy. Both camps are confident; both can't be right on every ticker. The only honest answer is to walk every prior 52-week-low close in the historical record and see what actually happened next.

So we built the test. Pick a ticker. Pick a direction (Short or Long). Set a profit target and a stop loss. The tool walks every bar in the historical record, fires an entry on every day the close prints a fresh 52-week low (and the prior bar's close was above), exits on whichever happens first (your profit target or stop loss), and shows you the result trade by trade. An equity curve sits next to a buy-and-hold line so you can see whether the play actually beat sitting still.

The 52-Week Lows tool is the answer to "bounce or breakdown" without the hand-waving.

52-Week Lows tool showing the Direction toggle (Short or Long), Profit Target and Stop Loss steppers, five stat cards (Win Rate, Avg Trade, Best Trade, Worst Trade, Avg Days in Trade), the trade log, the equity curve vs buy and hold, and the Trade Entries and Exits price chart

Pick a ticker from the pills (SPY, QQQ, IWM, AAPL, NVDA, TSLA, PLTR are pre-loaded; the More dropdown adds AMD, AMZN, GLD, GOOGL, META, MSFT, NFLX, SLV; or type any symbol). The Parameters sidebar gives you three controls: Direction (Short the breakdown or Long the bounce), Profit Target (5–50%, default 10%), and Stop Loss (5–50%, default 5%). Entry is fixed: every fresh 52-week-low close fires a position on the close in the chosen direction.

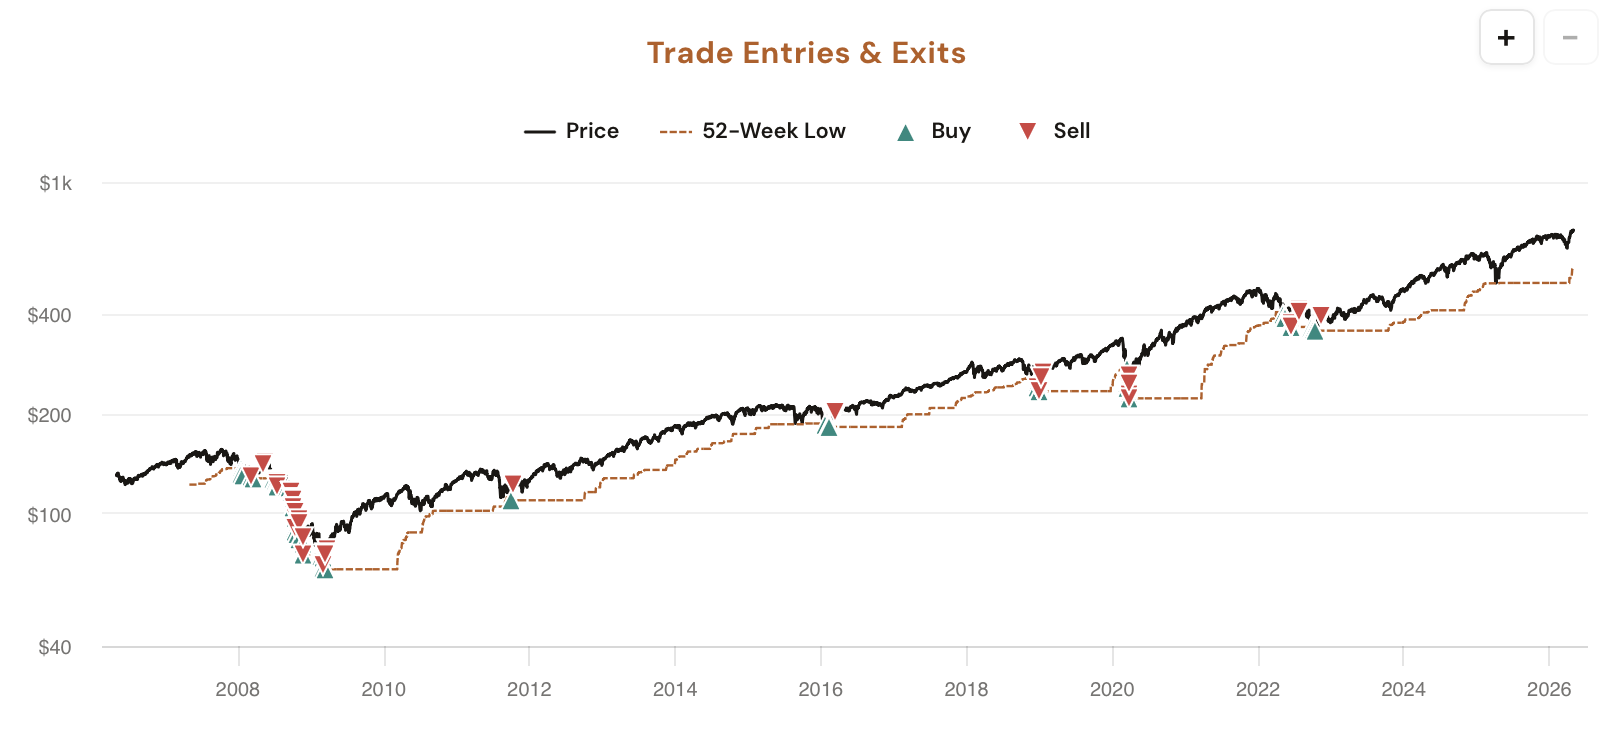
The main panel returns five stat cards plus a collapsible trade log listing every individual trade by entry date, entry price, exit date, exit price, days held, exit reason (target or stop), and return. Underneath, an equity curve compounds your strategy's per-trade returns and overlays a buy-and-hold curve on the same ticker, and a Trade Entries & Exits price chart plots every 52-week-low trigger directly on the price line.

What the Tool Shows You

Five stat cards, a per-trade audit log, an equity curve vs buy and hold, and a price chart with every 52-week-low entry and its corresponding exit marked, all running over 20+ years of bars on whichever ticker you load.

Direction

Short or Long Toggle

Short: sell on the new 52-week-low close, win when price drops further (target hit) or stop out when it rises (stop hit). Long: buy on the new 52-week-low close betting on a bounce, win when price rises (target hit) or stop out when it drops further (stop hit). One toggle, completely different trade logs.

Entry Trigger

Fresh 52-Week-Low Close

Every entry fires on the daily close that prints a new 52-week low (price closes lower than every close in the prior 52 weeks). Only the FIRST close of each new 52w-low leg fires a trade. After a profit target or stop loss exit, the system has to wait for a brand-new 52-week low to be set before the next entry triggers.

Exit Rules

Profit Target + Stop Loss Steppers

Two steppers (5–50% each). Every position auto-exits at whichever fires first: the profit target in the trade direction or the stop loss against it. Defaults are 10% and 5%, but you can dial them to match the risk:reward you actually trade.

Stat Cards

Win Rate, Avg, Best, Worst, Hold Time

Five numbers off the matched sample: Win Rate, Avg Trade (winners and losers blended), Best Trade, Worst Trade, and Avg Days in Trade. Hover any card for the exact filter context that built the sample.

Equity Curve

Strategy vs Buy & Hold

An equity chart compounds your strategy's per-trade returns and overlays a passive buy-and-hold curve of the same ticker. The gap between the two lines is the only honest answer to "did this beat sitting still?" Same starting capital, same end date, same ticker.

Per-Trade Log

Every 52w Low, Audited

A collapsible table listing every individual trade with entry date, entry price, exit date, exit price, days held, exit reason (target hit, stop hit, or open), and return. Useful for spotting whether the average is propped up by a couple of crash-cycle outliers or sits on a consistent cluster.

Why each parameter matters

52-week lows are asymmetric across tickers. Strong-trend names tend to print 52w lows in clusters during real bear markets, then bounce hard once the dust settles. Weak names tend to make a string of new lows over years, with bounces that fail. The tool's two real knobs (Direction and Exits) are what you use to find which kind of name you're trading.

Direction

The Direction toggle changes the entire question. Short mode asks "does the breakdown continue?" Long mode asks "is the low the buy?" On the same ticker with the same exits, these two backtests can produce radically different equity curves. If the long-side equity beats the short-side equity, the ticker tends to bounce off lows; if the short-side beats long, momentum tends to extend. Either answer is useful, and the tool gives you both.

Profit Target

Tighter targets (5–8%) cycle capital faster but cap upside on the rare blow-off bounce or breakdown. Wider targets (15–30%) ride the move longer at the cost of more open trades sitting around. The trade log lets you see how often the target actually fires vs how often the stop saves the day.

Stop Loss

52w-low entries can move violently against you in either direction (a long can be stopped out by a sharp continuation lower; a short can be stopped out by a vertical face-ripping bounce). Tight stops (3–5%) protect against whippy reversals but get hit on noise. Wide stops (8–15%) tolerate the wobble at the cost of bigger single-trade losses. The Worst Trade card tells you what the wider stop actually cost.

All three controls compound. Long with 10%/5% on SPY produces a totally different trade log than Short with 10%/5% on the same ticker. Both are valid; both tell you something different. The tool lets you stress-test which combination historically held an edge on the ticker you trade.

How Traders Are Using It

Five workflows that lean on the 52-week-low backtest with custom exits.

1

Decide bounce or breakdown before you trade

Your watchlist name just printed a fresh 52-week-low close. Should you short the falling knife or buy the panic? Open the tool, run both directions with the same exits, and read the historical Win Rate plus Avg Trade for each. The data either backs the bounce, backs the breakdown, or says it's a coin flip.

2

Compare bounce-vs-breakdown across tickers

Run both directions on SPY, then on QQQ, then on a single name like AAPL. The five stat cards make it trivial to see which tickers tend to bounce off 52w lows and which tend to break down further. Pick the ticker whose response profile fits the trade you actually want to take.

3

Tune your exits against the equity curve

Sweep the Profit Target and Stop Loss steppers up and down on a fixed direction. Watch the equity curve respond in real time and compare it to the buy-and-hold line. The combination where the strategy curve sits highest is your historical sweet spot for that ticker and that direction.

4

Stress-test with the worst trade

The Worst Trade card surfaces the single ugliest loss the strategy ever took, even with your stop loss in place (a sharp gap can blow past the stop, especially on shorts where bounces can be vertical). That's the right number to anchor your max-loss assumption on a single trade. Don't size to the average, size to the tail.

5

Audit the sample with the trade log

A 60% win rate on 8 trades is noise. The same rate on 80 trades is signal. Open the trade log and scan the per-trade dates and returns. If the average is propped up by trades clustered in one bear market and the rest are flat or losing, the headline number is misleading and the log makes that obvious.

Try it on the ticker you trade

52-Week Lows is available in your dashboard under Backtesting Tools. CI Volatility members see the full Direction, Profit Target, and Stop Loss controls; free users see the tool running on default parameters with the controls locked behind a sign-up prompt.

Open 52-Week Lows

Comments

Loading comments…