The Full Suite
Every tool listed above is available to CI Volatility members. They all pull from the same real-time and historical data, and they're designed to work together.
The strategy is yours. The data is ours.
CI Volatility has 20+ tools. Here's a guide to which ones fit your trading style.
Every trader approaches the market differently. Some sell weekly options. Some day trade gaps. Some wait for VIX spikes and go short volatility at the right moment.
The tools on CI Volatility were built to support all of these approaches. But with 20+ tools in the suite, it's not always obvious which one fits your strategy. This guide maps the most common trading styles to the specific tools that serve them.
If you're selling 0DTE SPX puts or calls, the single most important question is: how often does the underlying move enough to breach your strike in a single day? The Probability Lab answers this directly. Set it to Daily mode, enter any ticker, and step through the threshold percentages. If you're selling a 1% OTM put, the tool tells you exactly how often that level gets hit.
The Sentiment Cheat Sheet gives you a quick bullish/bearish read from 20 technical indicators before you place the trade.
The Weekday Patterns tool shows which days of the week tend to move the most for each ticker. Some days are historically more volatile than others, which directly affects 0DTE pricing and risk.
Probability Lab → Sentiment Cheat Sheet → Weekday Patterns →Switch the Probability Lab to Weekly mode and the analysis shifts from daily moves to weekly moves. Now you can see how often a stock moves 3%, 5%, or 10% in a single week. If you're selling a weekly strangle, this tells you how often your strikes get tested.
Probability Lab →The Probability Lab in Monthly mode shows you how often a ticker moves beyond a given threshold over a full month. If you're selling a 30-day put spread on UVXY, this tells you the historical probability of a move large enough to threaten your position.
The Seasonality tool breaks down performance by calendar month. Some months are historically much stronger or weaker for specific products. January behaves differently than August. Selling premium in a historically low-vol month is a different trade than selling into a historically volatile one.
Probability Lab → Seasonality →If you're trading the open, the Gap Fill Tool is essential. Enter any ticker and a gap percentage, and it shows you how often gaps of that size fill intraday, how the stock typically closes relative to the open, and the full timing breakdown. If UVXY gaps up 4% at the open, the tool tells you the historical probability of that gap filling before the bell.
The Weekday Patterns tool shows which days of the week tend to move the most for each ticker. If you're looking for the best day to enter or exit a position, the historical return data by weekday gives you an edge.
Gap Fill Tool → Weekday Patterns →The 1-Day Outlook was built specifically for this. Enter any ticker, and it finds every historical day with a similar move to today's, then shows you the next-day win rate, average return, and full distribution. Filter by VIX regime to see how the odds change depending on the volatility environment.
The Weekday Patterns tool adds another layer. If today is Wednesday and you're deciding whether to hold overnight, check whether Thursday has a historical directional bias for your ticker.
1-Day Outlook → Weekday Patterns →If you're shorting vol (buying UVXY puts, selling VIX calls, or holding inverse vol products), the Decay Projection tool is your starting point. Enter any number of days and see the projected price decline for every leveraged ETF based on historical decay rates and spike-adjusted projections.
The Spike Backtester lets you test short vol entry and exit rules across the full history. It brute-forces 57,720 combinations per ticker to find the historically optimal parameters for spike-based short entries.
The VIX Deep Dive gives you the term structure context. Check whether the VIX curve is in contango or backwardation, and what that has historically implied for the next 1 and 5 trading days. Shorting vol in steep contango has a very different risk profile than shorting into a flat or inverted curve.
Decay Projection → Spike Backtester → VIX Deep Dive →The Long Vol Signal is the most direct tool for this. It runs two independent signal tiers that monitor VIX price action, RSI dynamics, momentum oscillators, volatility expansion, and put/call sentiment in real time. When conditions align, a signal fires on the chart and appears in the Vol Radar on the dashboard.
The Spike Analyzer shows you what happened after every historical spike of a given magnitude. If UVXY is up 20% from its all-time low, the tool shows you how every previous 20% spike resolved, including forward returns and time back to lows.
The Spike Probability Ladder takes it further. If UVXY has already spiked 20%, what are the odds it reaches 30%? 50%? The ladder shows conditional probabilities of continuation at every level.
Long Vol Signal → Spike Analyzer → Spike Probability Ladder →Every tool listed above is available to CI Volatility members. They all pull from the same real-time and historical data, and they're designed to work together.
The strategy is yours. The data is ours.
Browse the full CI Volatility tool suite and find the ones that fit your process.
View All Tools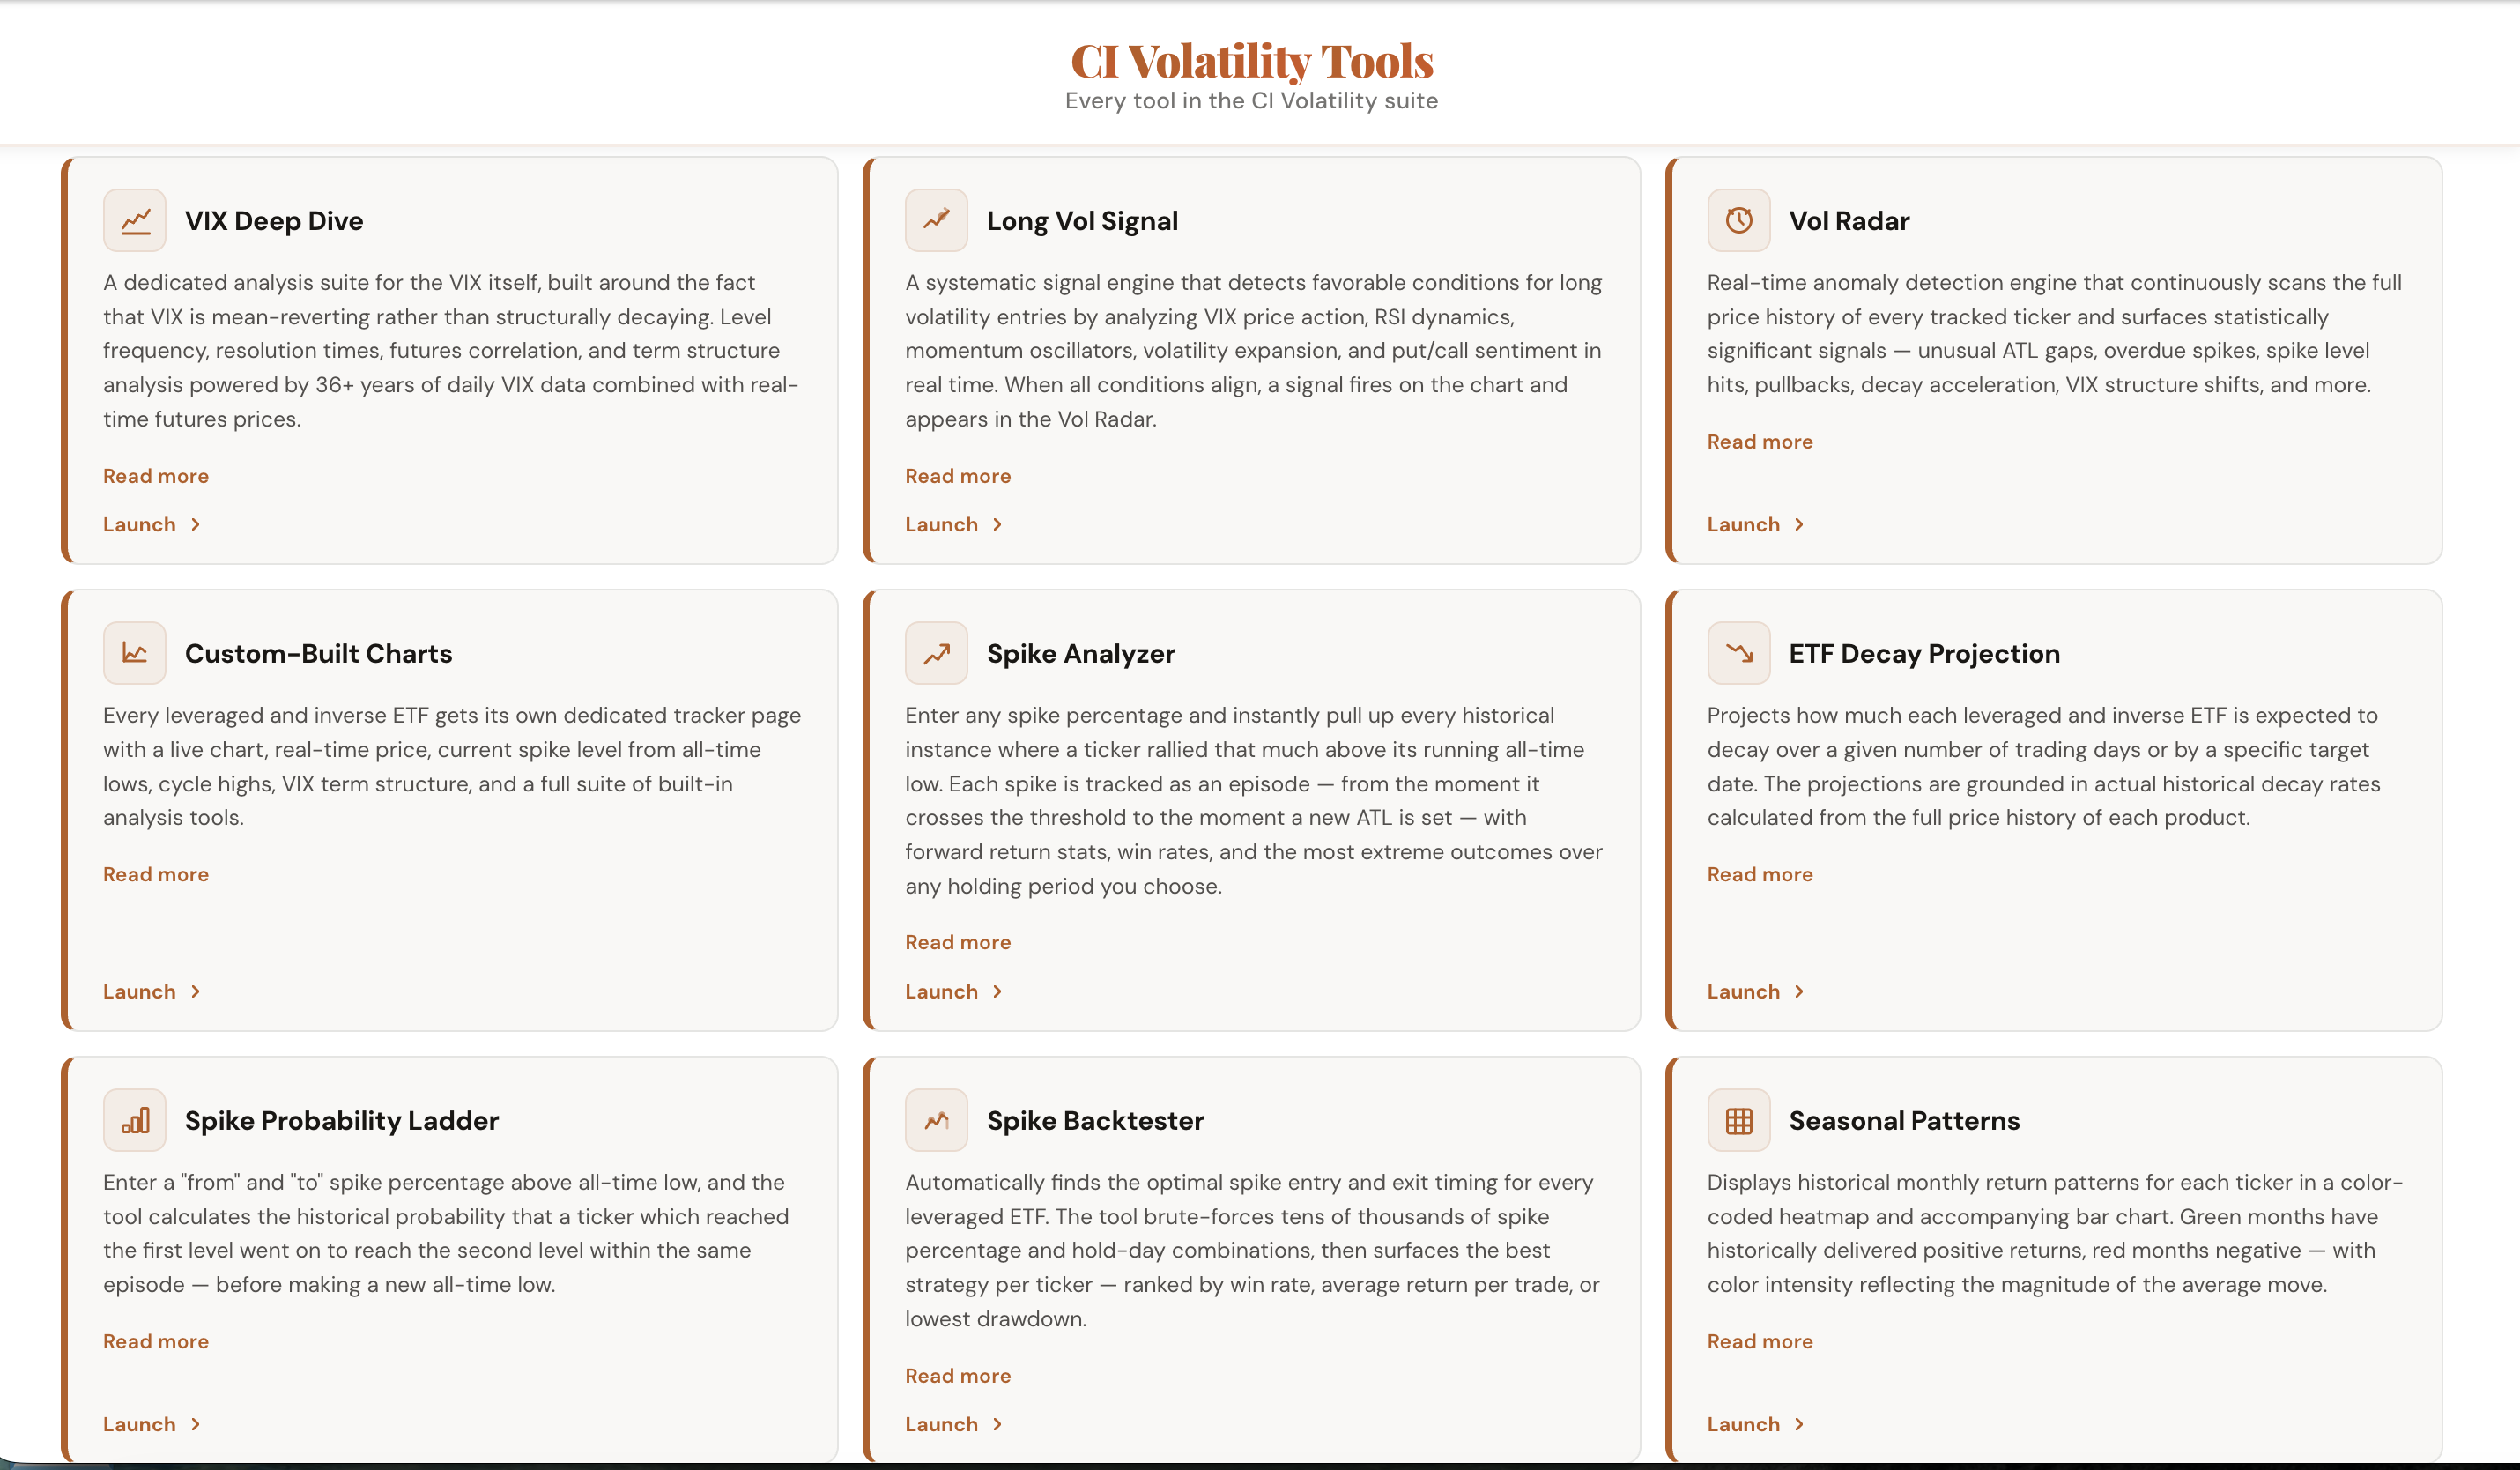
Comments
Loading comments…