Our 1-Day Outlook tool answers this question with real data.
UVXY just dropped 4% today. VIX spiked 6% and is sitting at 28. You're staring at the screen wondering: based on history, what tends to happen to these products tomorrow?
Volatility products are unique. They don't follow the same patterns as equities. A 4% drop in UVXY after a spike means something completely different than a 4% drop during a slow grind lower. The VIX regime at the time changes everything.
Most traders rely on feel or social media to gauge what comes next. But volatility has a deep statistical record, and the patterns are measurable.
The 1-Day Outlook tool was built to answer exactly this question.
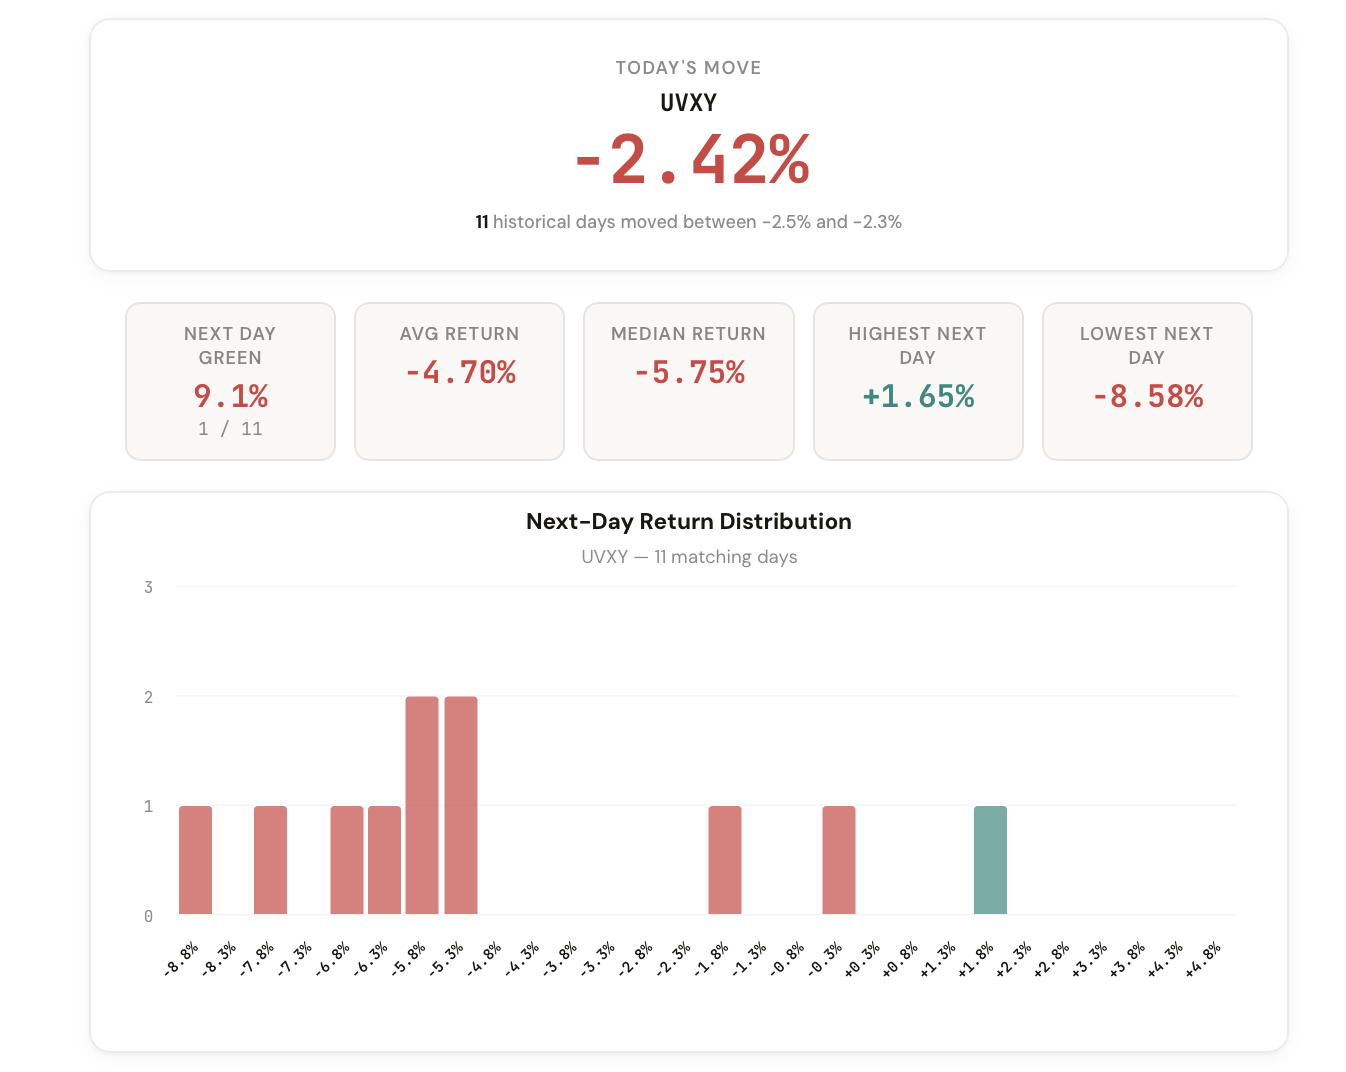
Pick any volatility product. VIX, UVXY, UVIX, VXX, SQQQ, SPXU, SOXS. The tool automatically detects today's move, finds every historical day with a similar percentage change, and shows you what happened the following session.
The results include the next-day win rate, average and median return, the best and worst outcomes, and a full distribution chart showing where returns clustered. You see exactly how many historical days matched and what the range of outcomes looked like.
A complete statistical picture of what happened next after similar volatility moves.
After a move of this size in UVXY or VIX, what percentage of the time did it go up the next day vs. down? The historical directional bias, instantly.
Did similar days tend to continue, reverse, or stay flat? See both the average and median next-day return for a clearer picture.
A full distribution chart showing where next-day returns clustered. See the range, the skew, and where the majority of outcomes landed.
A 3% UVXY drop when VIX is at 14 tells a very different story than the same drop when VIX is at 35. Filter by regime to isolate the context that matches today.
The tool auto-sets a 1% range from today's move. Widen it for more data points or narrow it for precision. Full control over the matching criteria.
VIX, UVXY, UVIX, VXX, SQQQ, SPXU, SOXS, ZSL, BOIL built in. Or type any custom ticker for instant analysis.
Volatility products have asymmetric return profiles. UVXY can spike 30% in a day and then grind down 2% per day for weeks. VIX can double in a week and mean-revert over the following month. The next-day behavior after a big move is not intuitive, and it varies dramatically depending on the environment.
The VIX regime filter is where this tool becomes particularly powerful for vol traders. Consider:
The historical outcomes for these scenarios are measurably different, and the tool lets you isolate each one.
Five ways members are applying the 1-Day Outlook to volatility trading.
UVXY spiked 15% yesterday and is down 3% today. Check whether that follow-through fade historically continues or if there's a second-day bounce.
VIX is up 6% today. Should you hold your SQQQ position overnight? The tool shows the historical probability of continuation vs. reversal.
Filter by VIX level to see how the same move plays out in different environments. A 2% UVXY drop in low vol behaves differently than during a crisis.
After VIX moves 3%, compare the next-day tendencies across UVXY, SQQQ, and SPXU to see which product has the strongest historical follow-through.
Does a big VIX move tend to continue or snap back? The distribution chart shows you whether outcomes skew toward reversal or continuation.
The 1-Day Outlook is available in your dashboard under Premium Tools. If you're a CI Volatility member, you already have access.
Open the 1-Day Outlook
Comments
Loading comments…