UVXY and SOXS look like completely different products. One is a 1.5x leveraged VIX futures ETF that spikes when the market panics. The other is a 3x inverse semiconductor ETF that rallies when chip stocks collapse. Different sectors, different leverage.
We analyzed over 14 years of daily price data across both products to compare their spike behavior, recovery timelines, and decay patterns. The results were surprising: at lower thresholds, these two ETFs behave almost identically.
How Often Do They Spike?
We measured their spike frequency at lower thresholds: +10% and +20% from their running all-time lows. Here's what the data shows:
| Spike Threshold | UVXY & SOXS |
|---|---|
| +10% spike | Every 16-24 days |
| +20% spike | Every 41-50 days |
At the +10% and +20% levels, the numbers are nearly identical. Both products spike with roughly the same regularity. A trader running the same spike entry strategy on either product would see comparable opportunities at these thresholds.
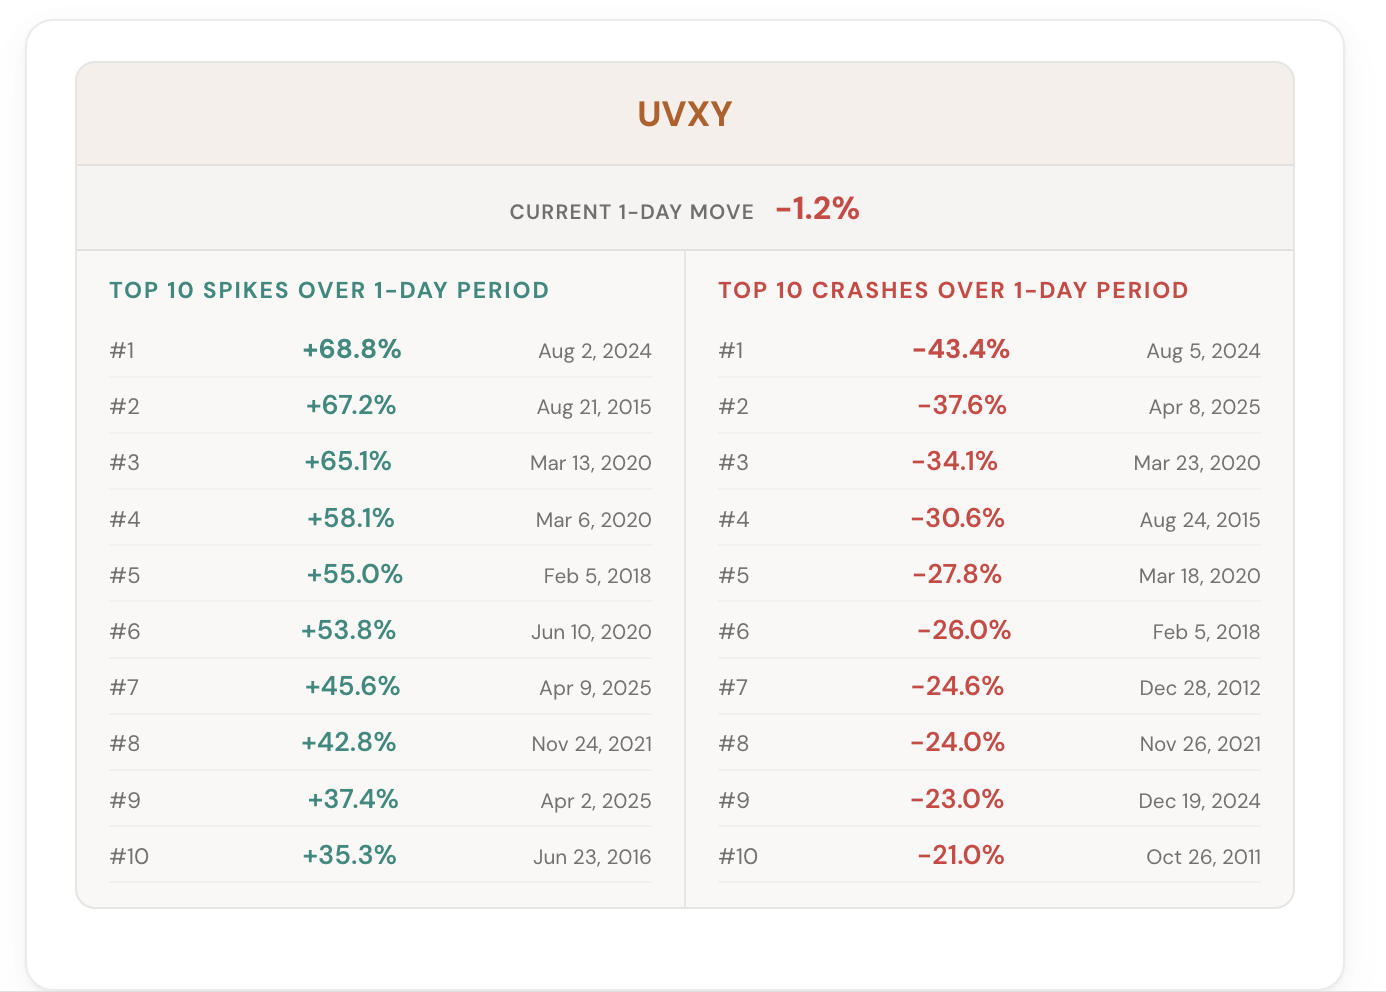
At +50% is where they start to diverge. UVXY reaches a 50% spike about twice as often as SOXS. This makes sense: VIX futures have explosive convexity during genuine fear events, while semiconductor selloffs tend to be more gradual.
How Long Until New Lows?
This is the number traders really care about. Once a spike happens, how long before the product grinds back down to a new all-time low? This determines how long your capital is tied up in a spike trade and how quickly the decay engine resets.
| After Spike Of | UVXY & SOXS Recovery |
|---|---|
| +10% | 4-5 days |
| +20% | 9-12 days |
At the +10% and +20% level, UVXY and SOXS have virtually the same recovery timeline. Both grind back to new all-time lows within 4-5 days after a 10% spike and 9-12 days after a 20% spike. For traders who enter on spikes and exit on new lows, the holding periods are interchangeable.
The Biggest Spike Ever
This is where the two products truly separate. UVXY's COVID spike in March 2020 was in a different stratosphere: a 13x move from its all-time low. The VIX's explosive convexity during genuine panic events creates spike potential that SOXS simply cannot replicate. When the entire market seizes up and implied volatility goes vertical, nothing moves like VIX futures.
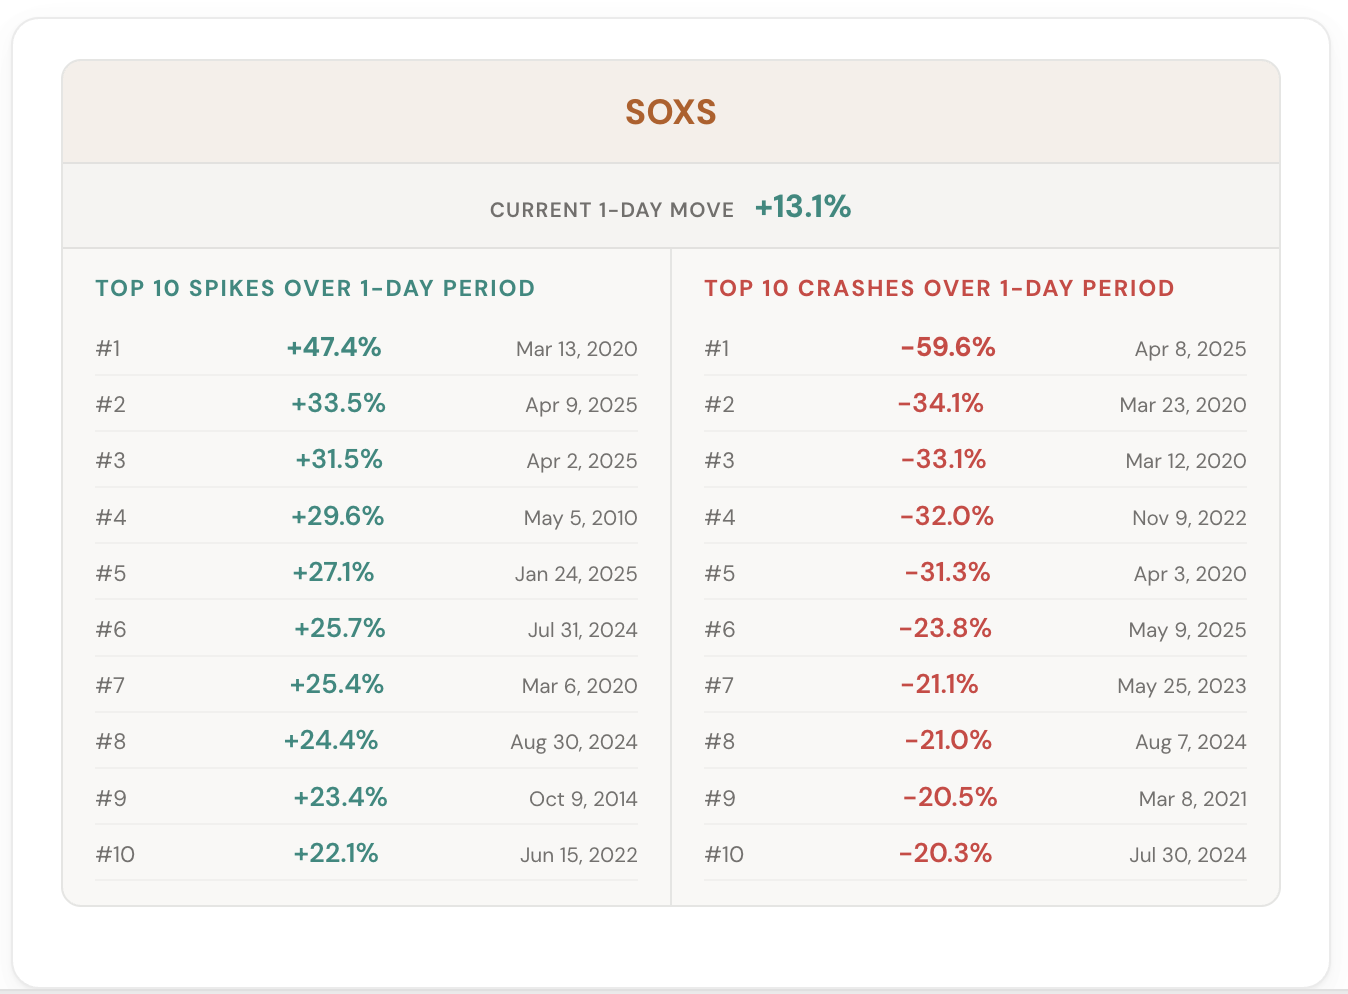
Interestingly, SOXS's largest spike wasn't COVID. It was April 2025, during the tariff shock. Semiconductors were hit harder by trade war escalation than by the pandemic. That tells you something about sector-specific risk: the worst-case scenario for SOXS isn't a broad market crash, it's a targeted policy event that hits chip stocks directly.
The Leverage Factor
One reason UVXY and SOXS appear more similar than you might initially think is the difference in their leverage multipliers. UVXY targets 1.5x daily exposure to VIX futures, while SOXS delivers -3x daily exposure to the semiconductor index. If SOXS were also structured at 1.5x leverage instead of 3x, its spike magnitudes would likely be more muted, with far fewer extreme outliers, narrower gaps in big-move frequency, and potentially altered decay and recovery profiles.
That said, this is beside the point for how we actually trade them. We trade the math on these products, and the math is very similar in practice at lower thresholds. The spike frequencies line up. The recovery windows line up. The strategies that work on one tend to work on the other.
What This Means for Traders
If you trade UVXY spikes, SOXS gives you a second product with remarkably similar behavior at the 10% and 20% thresholds. You can diversify your spike trading across two uncorrelated sectors without changing your strategy parameters.
Use the UVXY ticker page and SOXS ticker page to see their current spike levels, cycle analysis, and all-time low distances side by side. Or run both through the Spike Analyzer to compare historical spike cycles in detail.
Comments
Loading comments…