We just launched the Spike Probability Ladder. Enter any two spike levels and see the historical probability of continuation across every ticker.
Your ticker just spiked 10% from its all-time low. The question every trader asks next: what are the chances it reaches 20%? 30%? 50%? These conditional probabilities are the difference between a well-timed entry and a blown-up account.
Most traders have no way to answer this question with data. They rely on gut feel, chart patterns, or someone else's opinion. But the historical record contains the answer for every spike level, across every ticker.
Until now, calculating conditional spike probabilities meant building your own database and running the numbers manually. For every ticker. For every level combination.
We built something better.
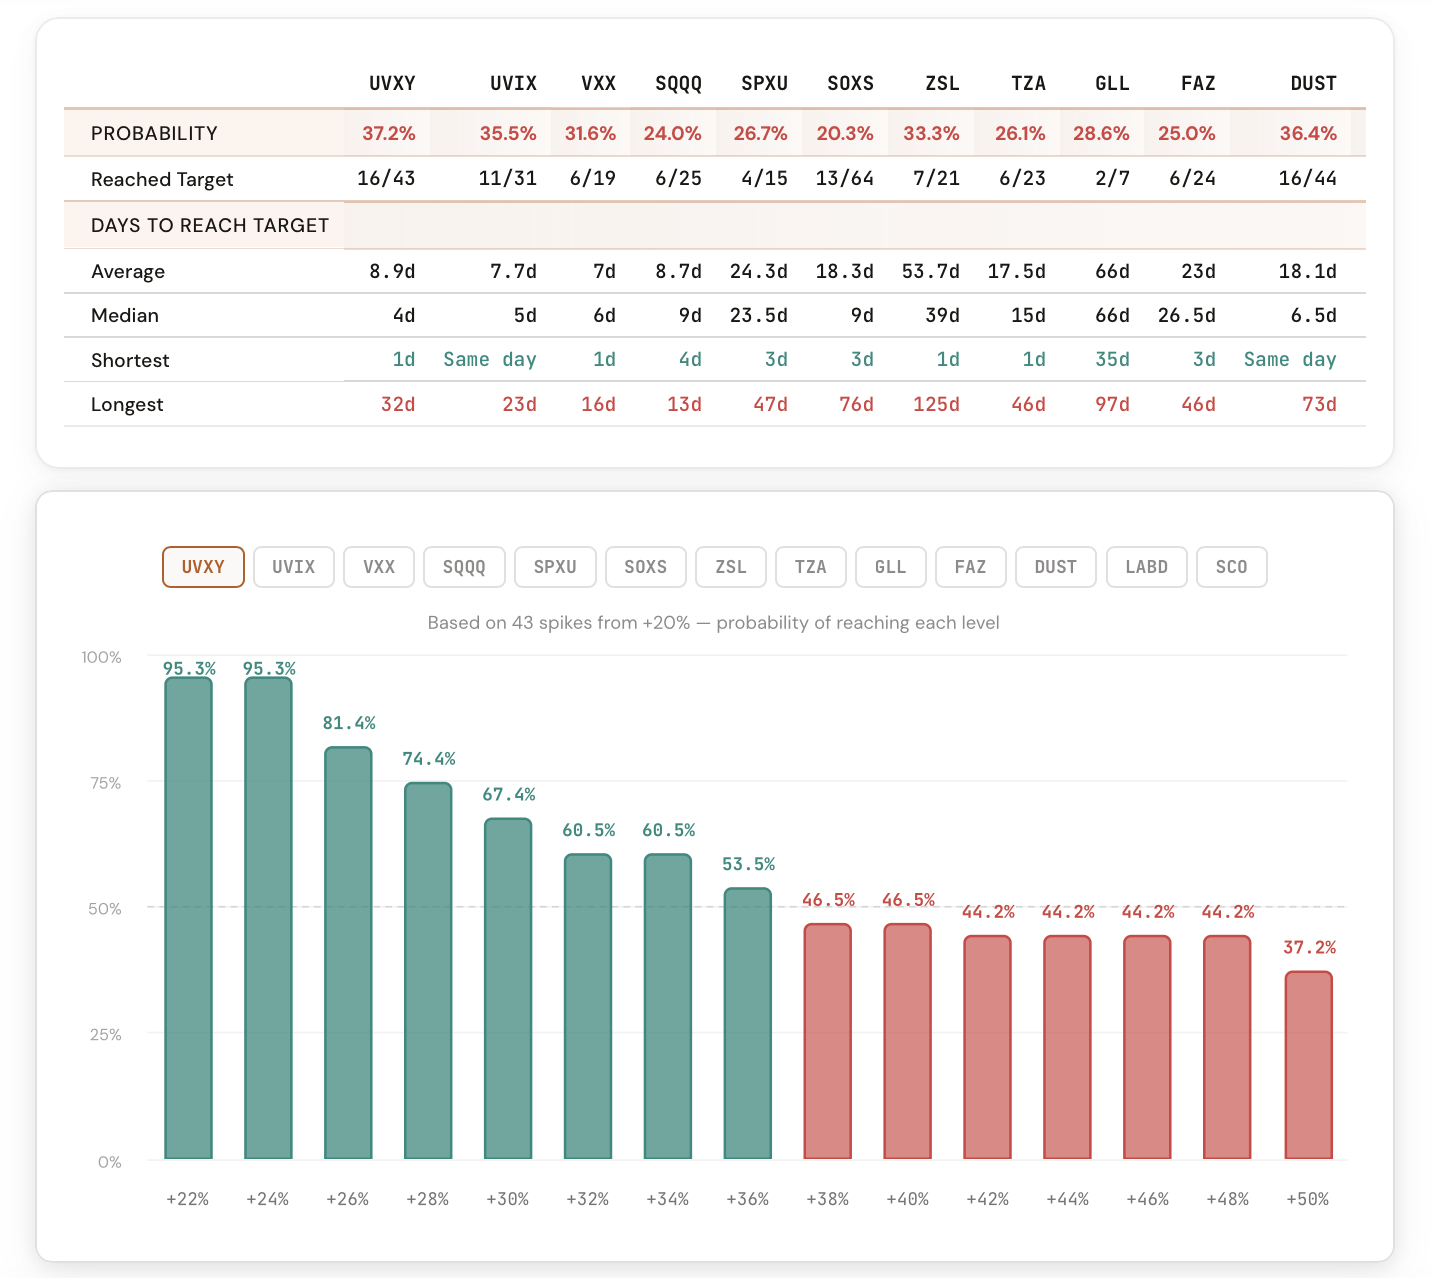
The Spike Probability Ladder answers one question: if a ticker has already spiked X% from its all-time low, what is the historical probability that it continues to Y%? Enter a "from" level and a "to" level, and the tool instantly calculates the conditional probability across every ticker.
Type 10% to 50% and you see, for each ticker, how often a 10% spike historically continued all the way to 50%. Instantly. Across all tickers simultaneously.
No more guessing. No more "it could keep running." Just the probabilities.
Conditional spike probabilities for any level combination you choose.
For each ticker, see the exact percentage of times a spike from level A continued to level B. Hard probabilities, not opinions.
UVXY, UVIX, VXX, SQQQ, SPXU, SOXS, ZSL, and BOIL compared side by side. See which products are most likely to extend.
Enter any combination: 10% to 50%, 25% to 100%, 5% to 200%. The tool handles any spike range you can think of.
Every probability comes with the number of historical occurrences behind it. Know whether you're looking at 50 data points or 5.
See how many times each ticker has even reached your "from" level. Some tickers spike to 100% regularly; others almost never do.
Results appear the moment you enter your levels. No loading, no waiting. Adjust the levels and the probabilities update instantly.
The tool scans every historical spike cycle for each ticker. A spike cycle starts at an all-time low and tracks the price as it rises. For your "from" level, the tool counts how many cycles reached that threshold. For your "to" level, it counts how many of those cycles continued to the higher threshold.
The tool gives you:
This is the tool you want open when a spike is underway and you need to decide: is this likely to keep going, or is this where it tops out?
Five ways members are already applying the Spike Probability Ladder to their process.
During a live spike, check the historical odds of it reaching the next level before deciding to hold or exit.
Only take trades where the conditional probability of reaching your target is above a threshold you define.
Compare which ticker has the highest probability of continuation from the current spike level.
Pair the probability of reaching your target with the probability of fading. Get both sides of the trade.
When social media says "this is going to 200%," check the actual historical probability.
The Spike Probability Ladder is available in your dashboard under Premium Tools. If you're a CI Volatility member, you already have access.
Open the Spike Probability Ladder
Comments
Loading comments…