Weekly options are the bread and butter of income trading. Sell a put or call on Monday, collect premium, and hope it expires worthless by Friday. But "hope" is not a strategy. The question you should be asking: how often does this stock actually move 3%, 5%, or 8% in a single week?
The Probability Lab now has a Weekly mode that answers this with historical data going back decades.
Why Weekly Frequency Matters More Than Daily
If you're selling weekly options, the daily move frequency is the wrong number to look at. A stock might only move 2% in a single day 10% of the time, but over 5 trading days those moves compound. The weekly return captures the full picture: how far did the stock actually travel from Monday's open to Friday's close?
Open the Probability Lab, select your ticker, click "Weekly" in the Period toggle, and set your threshold. The tool instantly shows you what percentage of all calendar weeks had a move of that size or larger. This is the number that matters for your weekly option.
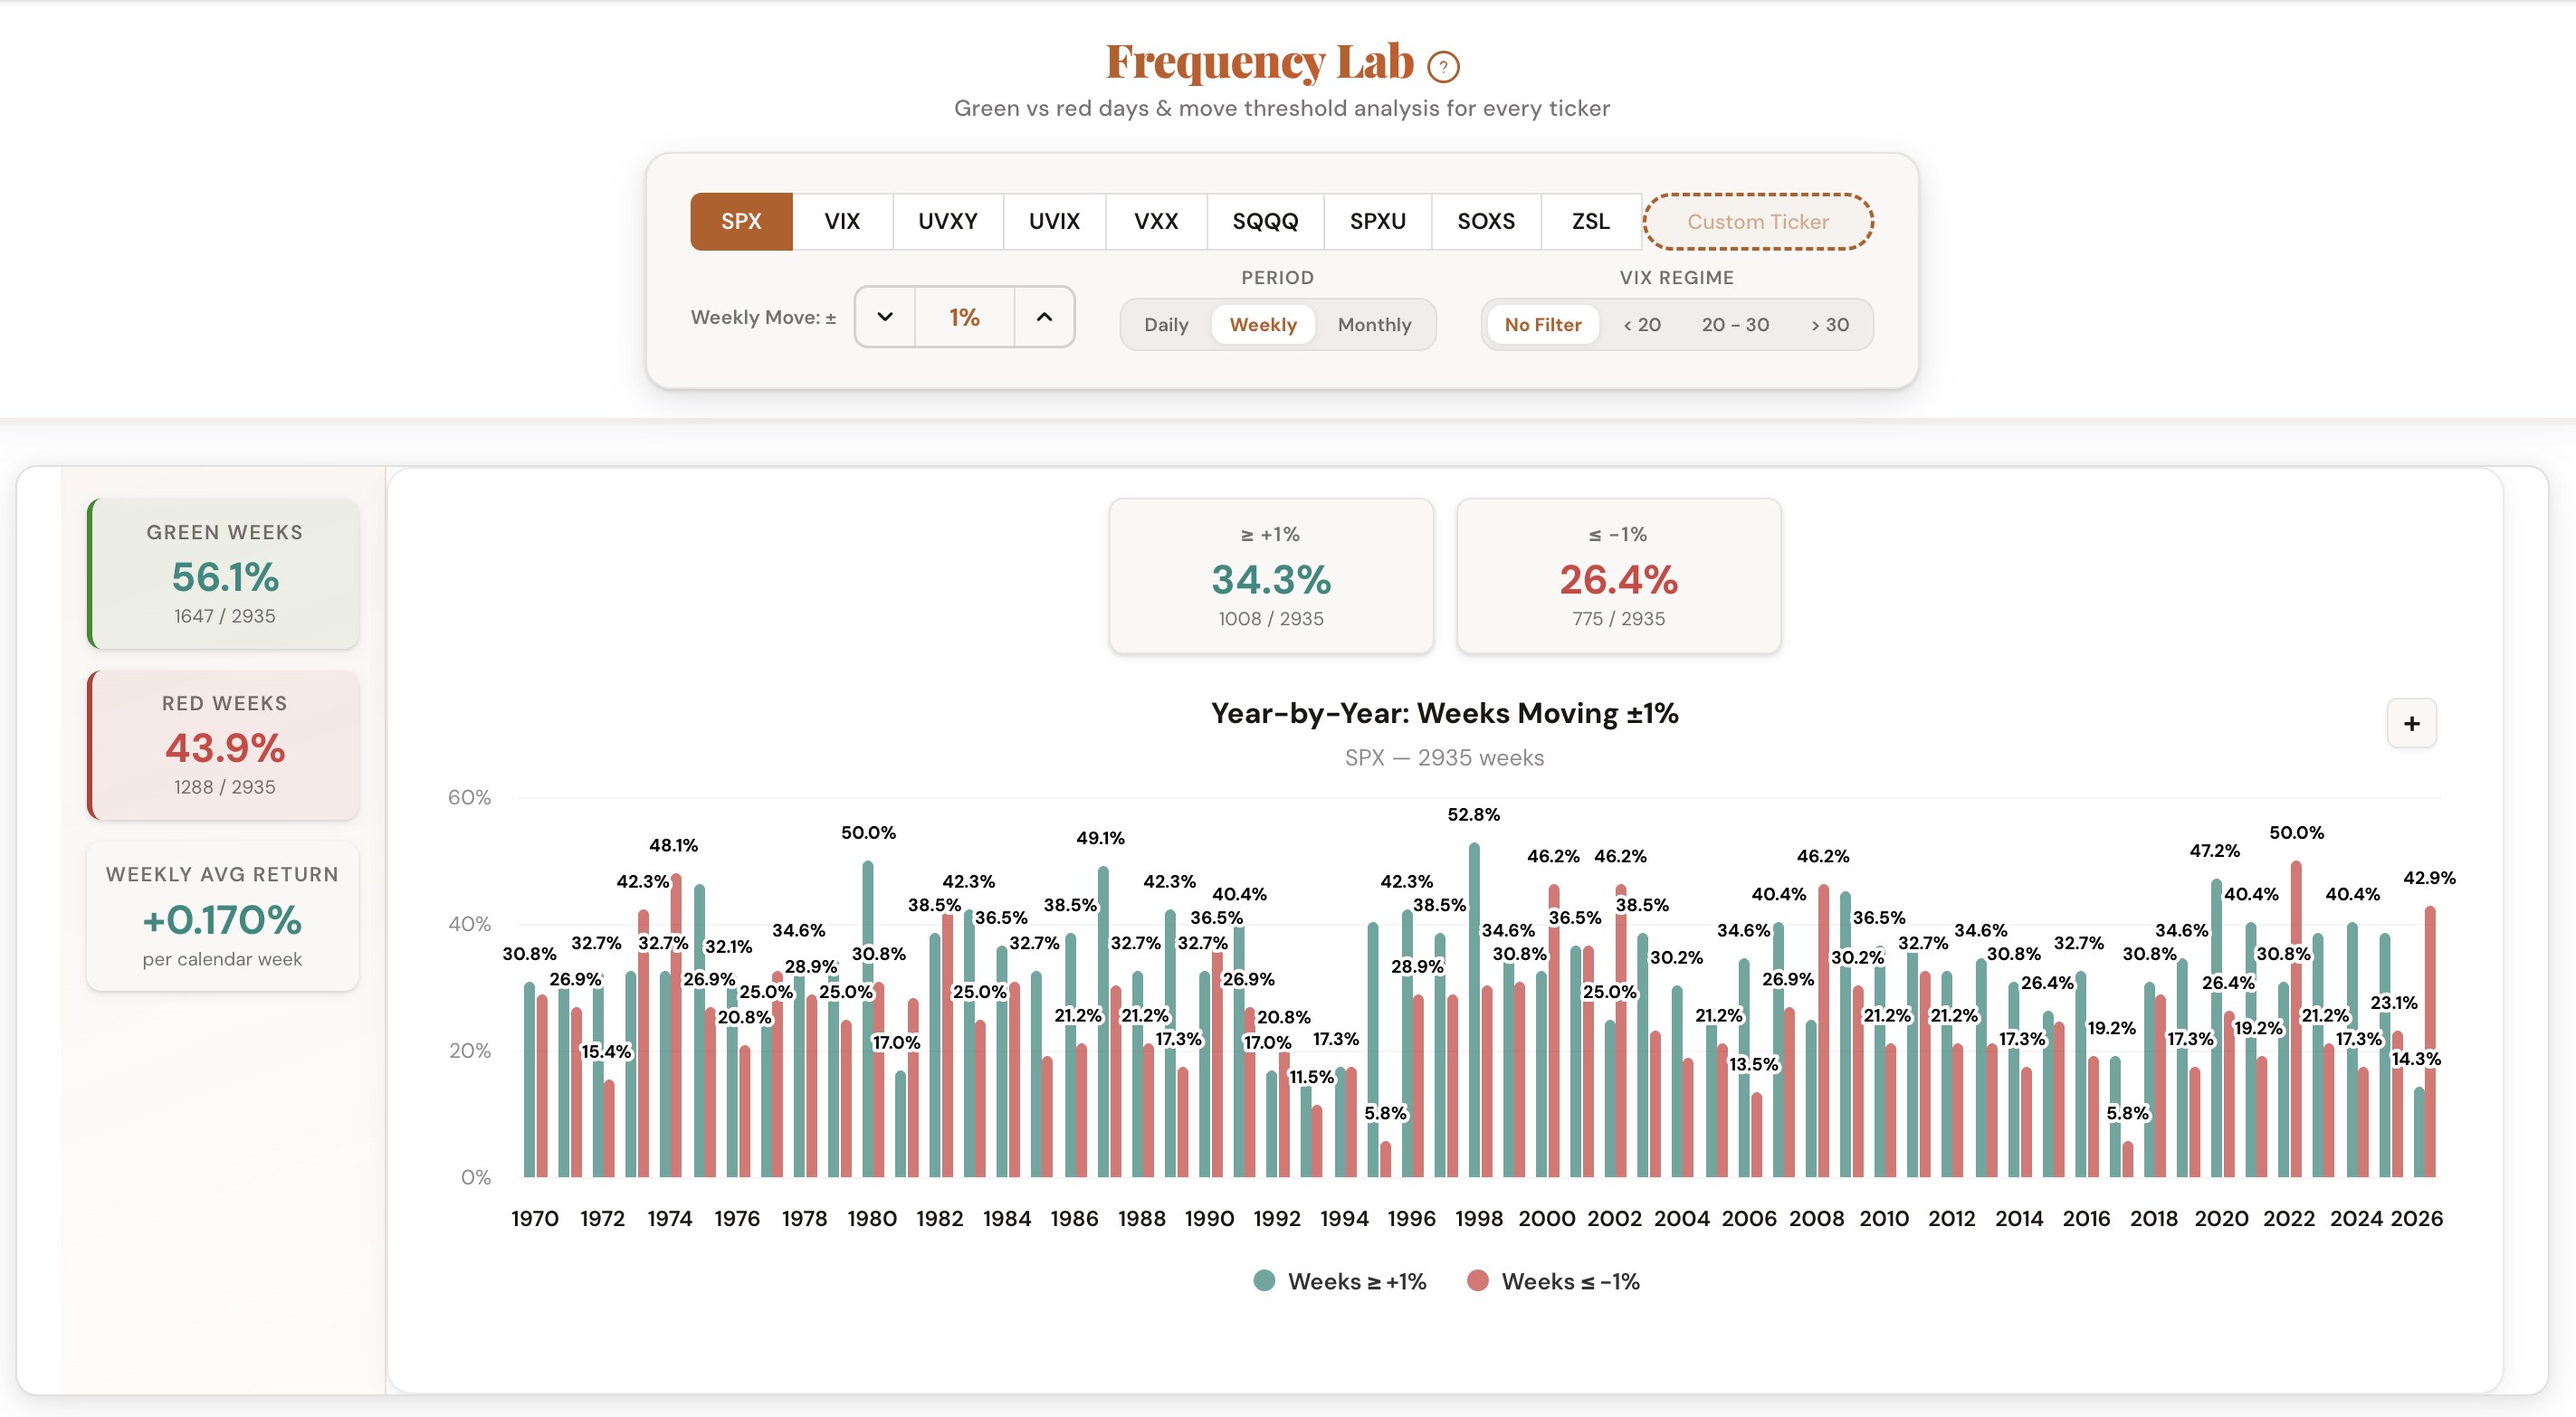
Selling Weekly Puts
You sell a weekly put on SPX at a strike 3% below Monday's open. Before entering the trade, open Probability Lab in Weekly mode and set the threshold to 3%.
The tool shows you exactly how often SPX drops more than 3% in a single calendar week. Toggle the VIX regime filter to see how this changes in different volatility environments. When VIX is above 30, weekly moves get significantly larger and your put is far more likely to go in the money.
Selling Weekly Calls
Selling covered calls or naked calls on a weekly basis? The same logic applies. Set the threshold to match the distance between the current price and your call strike. Weekly mode shows how often the stock rallies that much in a single week.
This is especially important for volatile names. TSLA might look safe at a 5% OTM weekly call, but Weekly mode shows you just how often TSLA rallies 5% or more in a single week. The answer might change your mind.
VIX Regime Filter for Weeklies
Weekly move frequencies shift dramatically with VIX. In Weekly mode, the VIX filter uses the VIX opening price on the first trading day of each week. This tells you: given where VIX started the week, how often did the stock move beyond your threshold by Friday?
Check the current VIX level before selling your weekly option. If VIX is at 28, filter by "20-30" to see the historical frequency under similar conditions. The difference between a calm market and an elevated one can double or triple the breach rate at the same strike distance.
Weekly vs Daily: Different Numbers, Different Decisions
The same stock, the same threshold, but a completely different probability. A 2% daily move might happen 8% of the time. But a 2% weekly move might happen 35% of the time. If you're sizing your weekly option based on the daily number, you're underestimating your risk.
Toggle between Daily and Weekly mode in the tool to see the difference side by side. It changes everything about how you pick strike distances for weekly expirations.
Comments
Loading comments…