We just launched the Seasonality Tool. Monthly return patterns and seasonal trends for every volatility product, backed by years of data.
Every volatility trader has noticed it: certain months feel worse than others. February seems to crush UVXY holders. Summer feels like a slow bleed. But is any of that real, or is it just selective memory?
Seasonality is one of the most discussed but least measured edges in volatility trading. People talk about "sell in May" or "October volatility" without ever looking at the actual numbers for the specific products they trade.
Until now, getting real seasonality data for leveraged and inverse ETFs meant downloading years of price data and building your own monthly return tables. Most traders never bother.
We built something better.
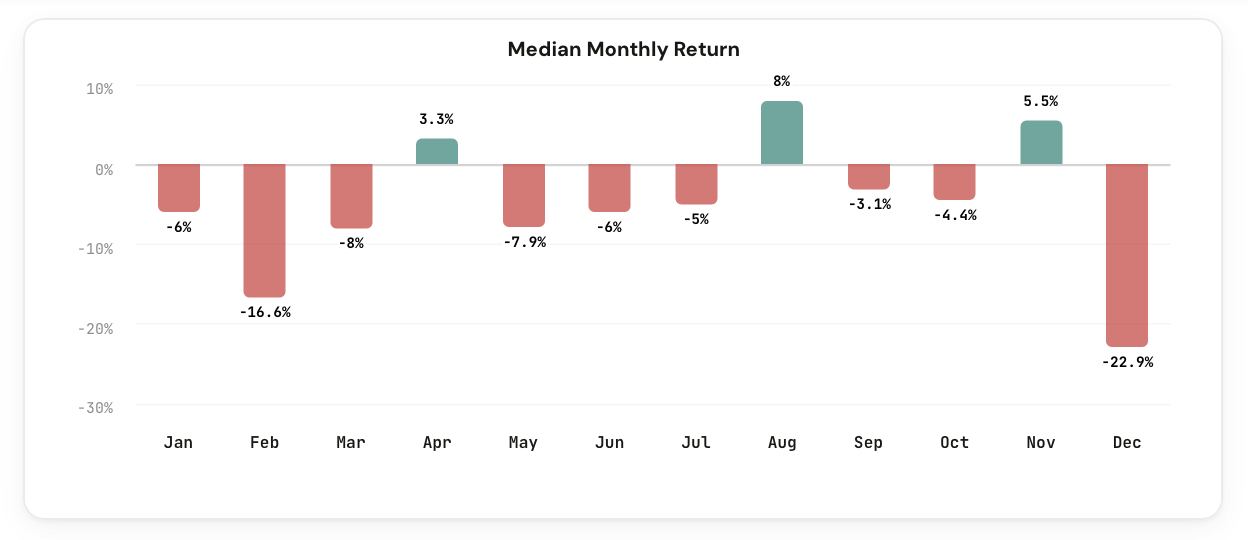
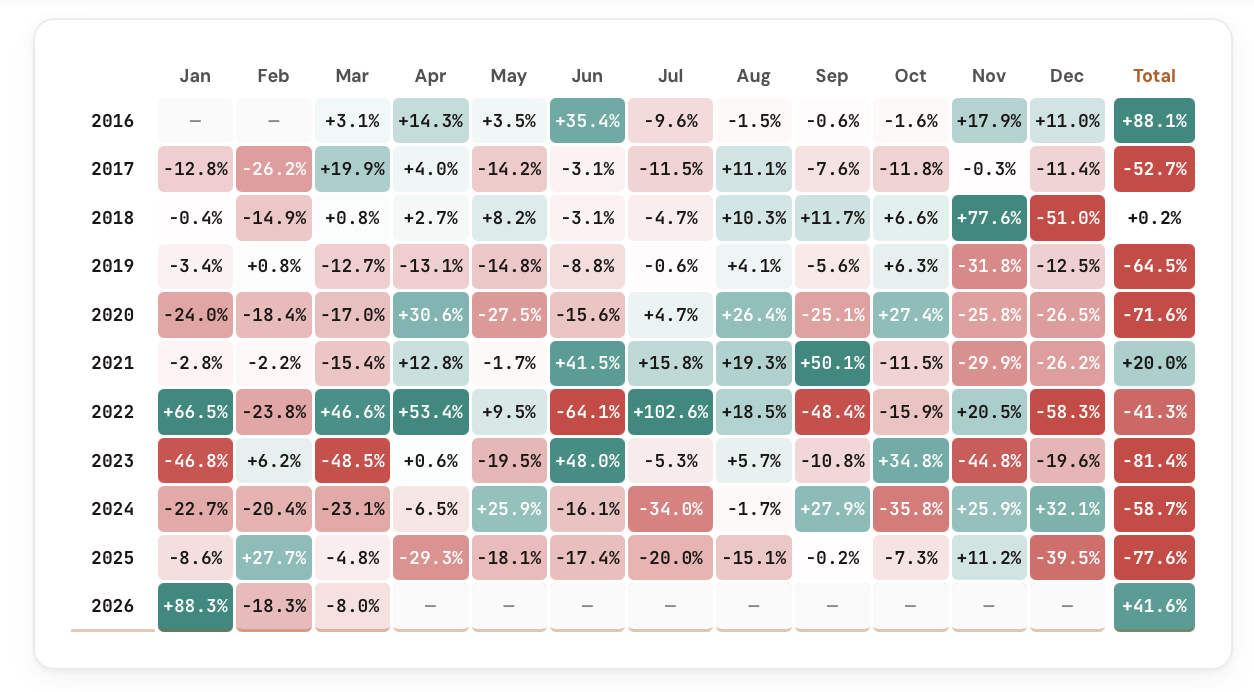
The Seasonality Tool shows monthly return patterns for every ticker in the CI Volatility suite. Pick any product, and you instantly see the median and average return for each month of the year, going back to the full available history.
Select UVXY and you see which months historically delivered the worst losses and which months offered brief reprieves. Switch to SQQQ or SOXS and compare whether the seasonal patterns hold across different leveraged products.
No more anecdotes. No more "I feel like March is always bad." Just the numbers.
Complete monthly return breakdowns for every ticker in the suite.
See the median and average return for each month, January through December. Toggle between the two to understand typical vs. mean-skewed performance.
A clean bar chart showing every month at a glance. Green for positive months, red for negative. Spot seasonal patterns instantly.
Switch to Detail view to see every individual year's return for each month. See the range, the outliers, and how consistent the pattern really is.
UVXY, UVIX, VXX, SQQQ, SPXU, SOXS, ZSL built in, plus BOIL and a custom ticker option for any symbol you want to analyze.
Summary gives you the quick read: median/average per month. Detail gives you the full dataset: every year, every month, every return.
Flip between tickers to compare seasonal patterns. See whether the worst month for UVXY is also the worst for VXX, or if the patterns diverge.
The tool calculates monthly returns for each ticker across its full available history. For each calendar month, it computes both the median return (the middle outcome, resistant to outliers) and the average return (which captures the full impact of extreme months).
The tool gives you:
This is the tool you want open when planning entries, exits, or hold periods around calendar effects. If your favorite stock historically loses 5% in April, that's context worth having before you go long in April.
Five ways members are already applying the Seasonality Tool to their process.
Avoid entering long volatility positions during historically weak months. Time entries for months with the strongest seasonal tailwinds.
Identify the months where decay and mean reversion are strongest. Use seasonal weakness as confirmation for short setups.
If your trade thesis requires holding for 2-3 months, check whether those months historically work for or against you.
Compare seasonality across tickers to pick the product with the best seasonal profile for your intended trade window.
Test common beliefs like "sell in May" or "October is volatile" against actual monthly return data for the products you trade.
The Seasonality Tool is available in your dashboard under Premium Tools. If you're a CI Volatility member, you already have access.
Open the Seasonality Tool
Comments
Loading comments…