The S&P 500 just dropped 1.2% today. You're sitting at your desk wondering: based on history, what tends to happen next? Does it keep falling? Does it bounce? How often does a move like this reverse the following day?
Most traders rely on gut instinct or social media sentiment to answer that question. Maybe you've seen someone tweet "oversold, bouncing tomorrow" or "this is just getting started." But none of that is backed by data.
Until now, getting a real answer meant manually pulling years of historical data, filtering for similar moves, and calculating the statistics yourself. Hours of work for a single lookup.
We built something better.
Introducing the 1-Day Outlook
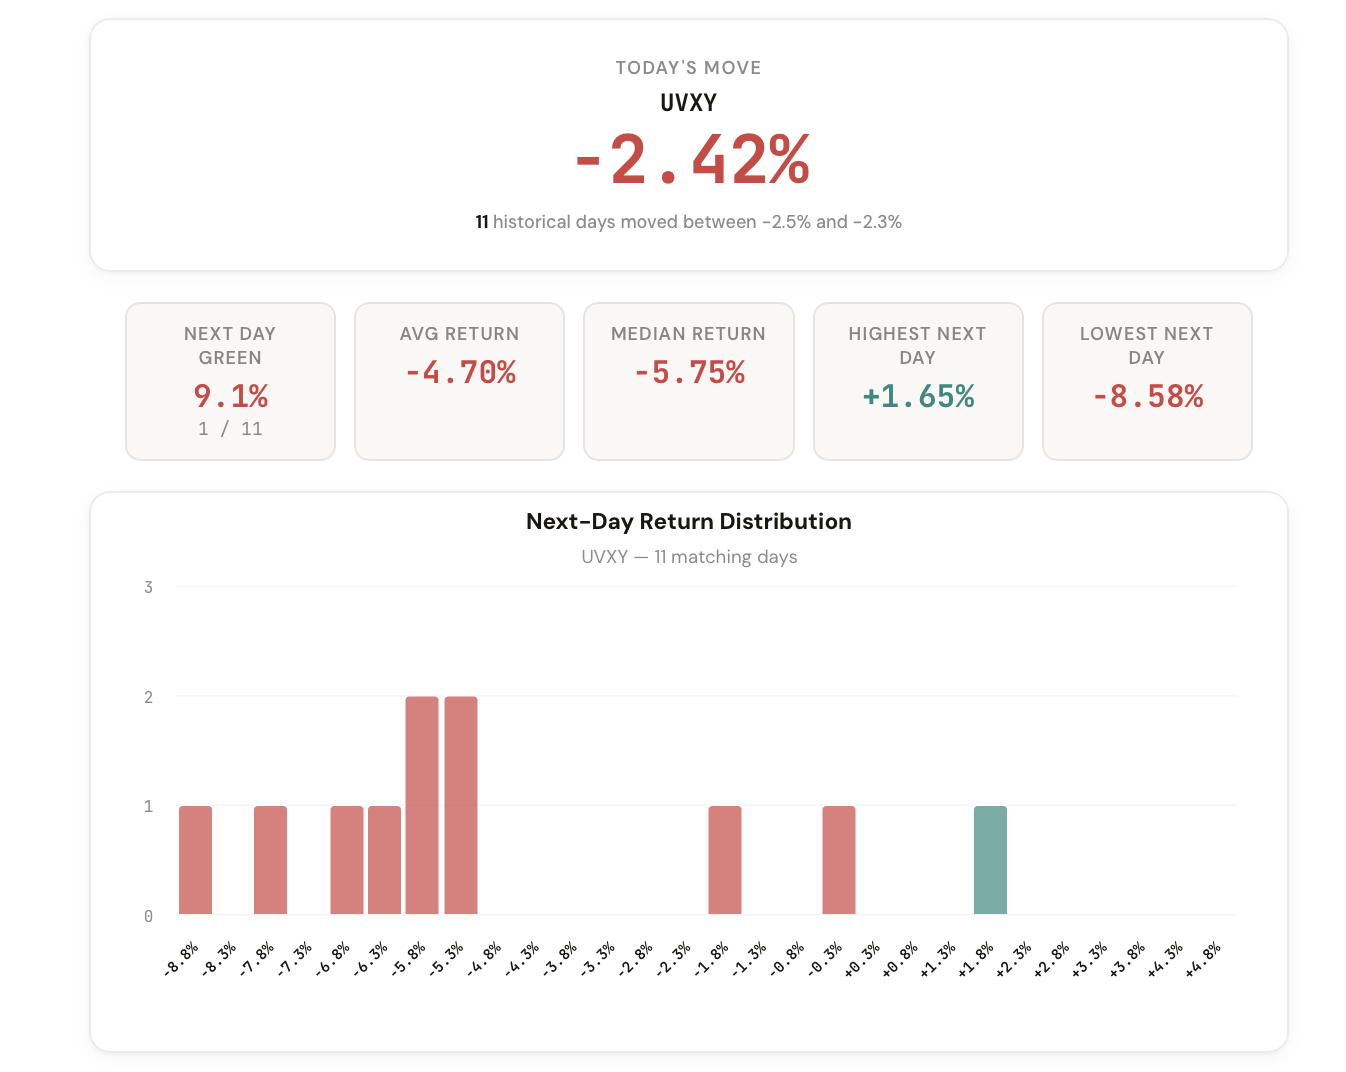
The 1-Day Outlook is the newest addition to the CI Volatility suite, and it does one thing exceptionally well: it tells you what historically happened the next trading day after a move like today's.
Pick any ticker. The tool automatically detects today's move, finds every historical day with a similar percentage change, and shows you exactly what happened the following session. Distribution charts, directional probabilities, average returns, and a complete log of every matching day.
Comments
Loading comments…