Most traders react to market moves in real time. The market drops 1.5% and they panic sell, or they rush to buy the dip at noon before the picture is clear. Both approaches share the same problem: they're acting on incomplete information.
There's a better approach. Wait until the final hour of trading. By 3pm ET, the day's move is largely decided. You know whether SPX is closing down 1%, up 2%, or flat. And with that single number, the Daily Momentum tool can tell you exactly what happened historically on the next trading day after a move like today's.
Why the Last Hour?
At 10am, the market might be down 1.8% but it could easily reverse by the close. At noon, you have more signal but still plenty of noise. By 3pm, you have roughly 85% of the day's final move locked in. The closing price is nearly set, which means Daily Momentum's input is nearly final too.
This is the sweet spot: enough information to generate a reliable historical signal, and still enough time to open a position before the close. You're not predicting where the market will close. You're waiting until you know, then acting on what history says happens next.
The Strategy: Four Ways to Position
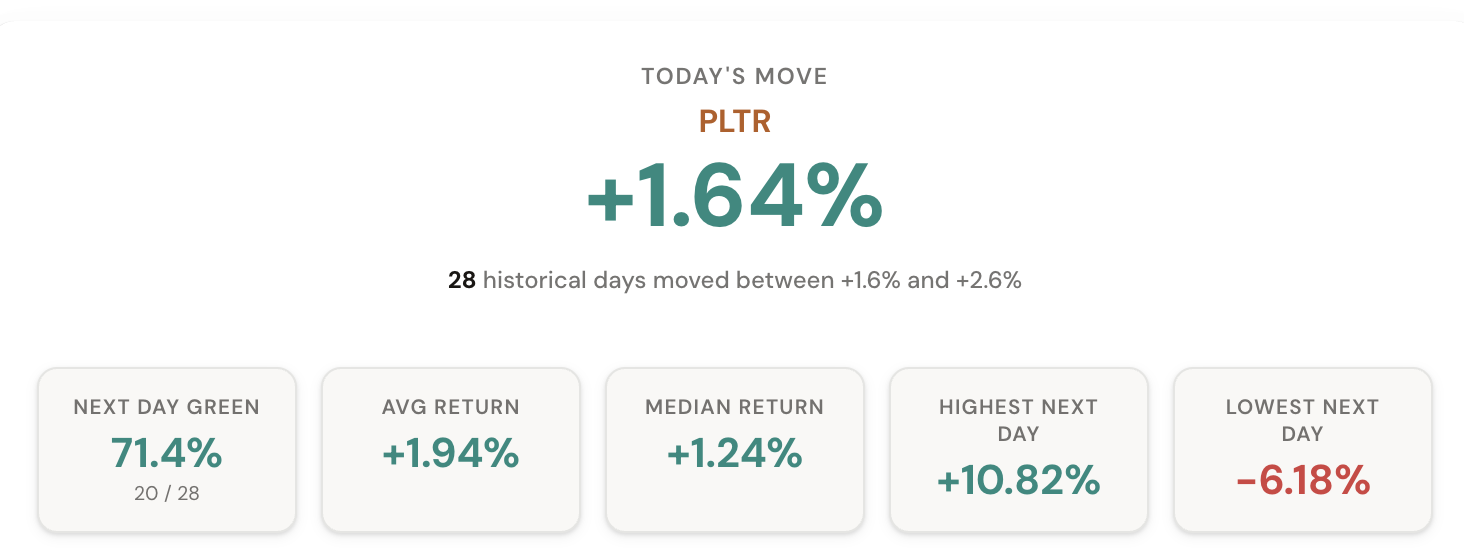
Open Daily Momentum during the final hour. Select your ticker. The tool automatically detects today's move and shows you the historical next-day distribution, directional bias, and average return. Based on that data, you have four ways to position:
1. Go Long
If history shows a strong bullish bias after today's move (say, 65%+ of similar days were followed by a green day with a positive average return), go long in the last hour and hold overnight for tomorrow. Daily Momentum gives you the exact win rate and average return for this setup.
2. Go Short
If the data shows a bearish next-day tendency (more red days than green, with a negative average return), go short the ticker. Same timeframe: enter in the last hour, exit the next day. The historical distribution shows you the range of likely outcomes.
3. Sell Options
If Daily Momentum shows that next-day moves after today's move tend to be small and clustered near zero, that's a signal to sell premium. Sell a straddle or strangle expiring tomorrow and collect theta. The distribution histogram tells you whether next-day moves are tight or wide. Tight distributions favor sellers.
4. Buy Options
If history shows a wide distribution of next-day returns after today's move, implied volatility might be underpricing the actual risk. Buy a straddle or a directional option expiring tomorrow. Wide historical distributions with fat tails favor buyers.
The VIX Filter Makes It Sharper
A 1% drop in SPX when VIX is at 15 is a very different event than a 1% drop when VIX is at 35. Daily Momentum has a VIX regime filter that lets you isolate historical matches to the current volatility environment. This sharpens the signal considerably.
Before placing your last-hour trade, toggle the VIX filter to match today's conditions. The next-day probabilities and average returns will shift, sometimes dramatically. In high-VIX environments, next-day reversals tend to be larger. In low-VIX environments, continuation is more common.
Why This Works
This strategy works because it removes the two biggest problems with overnight positioning: acting too early, and acting without data. By waiting until the last hour, you know the input. By using Daily Momentum, you know the historical output. You're not guessing. You're matching today's move to decades of history and positioning accordingly.
It also works across any ticker the tool supports. SPX, QQQ, TSLA, AAPL, UVXY -- each has its own next-day tendencies. A 2% drop in TSLA leads to very different next-day behavior than a 2% drop in SPX. The tool quantifies these differences.
Comments
Loading comments…