Whether you are sizing a position, evaluating roll yield, or simply getting a read on how the market is pricing forward risk, the term structure tells you what you need to know.
Today we are launching our realtime VIX Futures Term Structure chart at civolatility.com/vix.
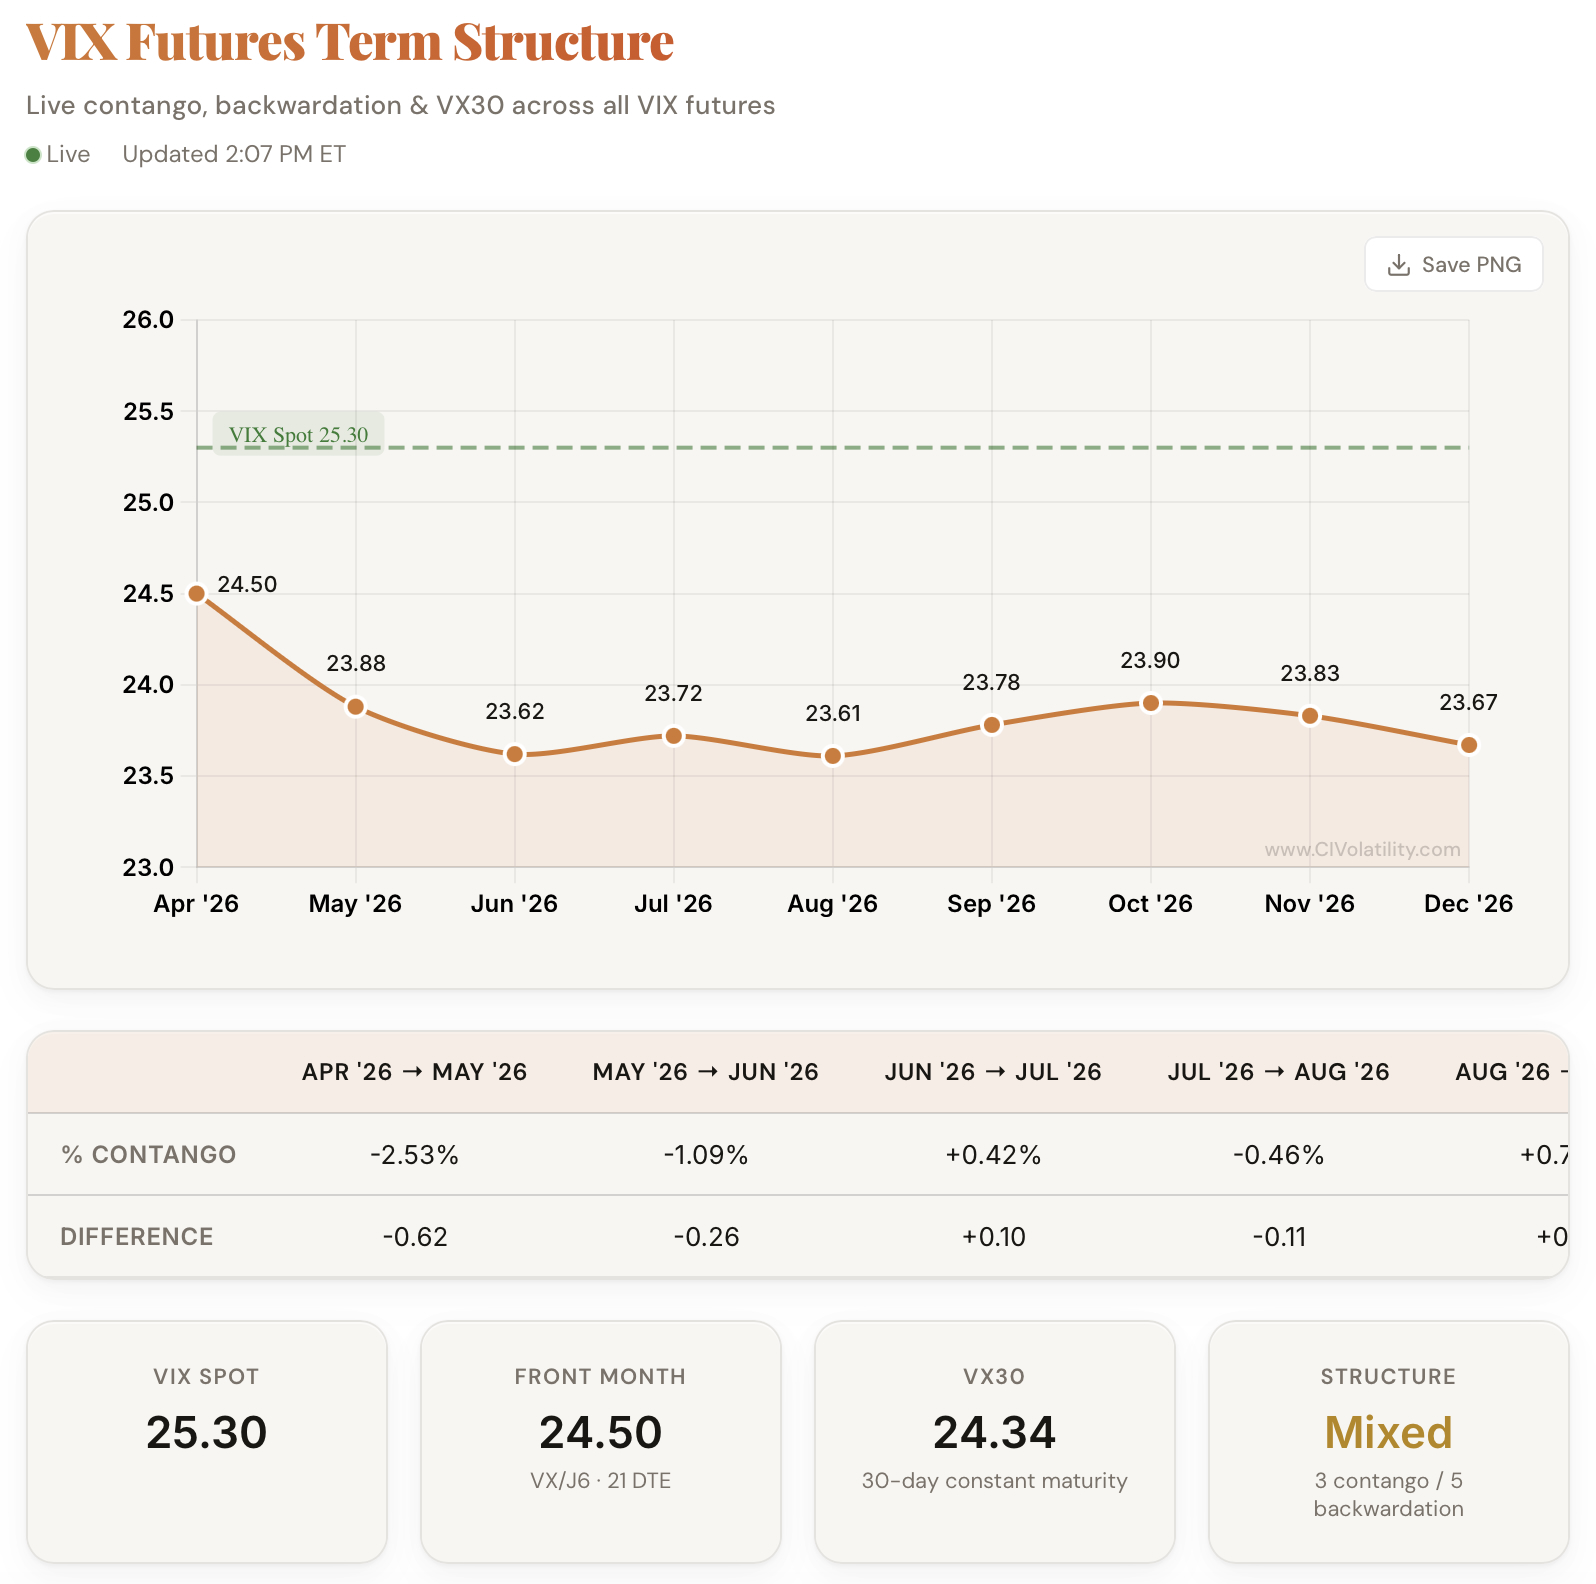
What It Shows
The tool plots every active monthly VIX futures contract alongside the VIX spot index. At a glance, you can see whether the curve is in contango, backwardation, or some combination of the two. Below the chart, a contango table breaks down the percentage change and raw price difference between each consecutive month, giving you the hard numbers when you need them.
Summary metrics include the front month price and days to expiration, a VX30 constant maturity interpolation, and an overall structure reading.
How It Works
The chart pulls live data from CBOE VIX futures quotes and VIX spot pricing. It updates automatically every 60 seconds during market hours. You can download the chart as a PNG for reports, presentations, or quick sharing with your team.
Comments
Loading comments…