We just launched the Gap Fill Tool, a new addition to the CI Volatility suite that answers this question with real data.
Every trader has felt it. You wake up, check pre-market, and your position has gapped 4% against you overnight. The first question that races through your mind is: Does this gap fill?
You've probably heard the old trading floor wisdom that "gaps always fill." It gets repeated in Discord servers and social media threads all the time. But how true is it, really? Does a 2% gap behave the same as a 6% gap? Does it matter whether the gap is up or down? And if it does fill, are we talking hours, days, or months?
Until now, answering those questions meant either trusting your gut, relying on secondhand anecdotes, or spending hours in a spreadsheet manually tagging gap days across years of price history.
We built something better.
The Gap Fill Tool is the newest addition to the CI Volatility suite, and it does one thing exceptionally well: it replaces speculation with data.
Pick any ticker. Enter a gap percentage. The tool instantly pulls every historical occurrence that matches your criteria and breaks down exactly what happened next. Not in theory, but in documented, verifiable price action.
No more guessing. No more "gaps always fill" platitudes. Just the numbers.
Three core views, each designed to answer a different layer of the same question.
After a gap of the size you specified, how often did the stock close higher than its open vs. lower? Know the directional bias before you trade.
Did the gap hold through the session, or did the stock fade back to the previous close by end of day? Critical for deciding whether to fade or ride.
What percentage of gaps filled before the closing bell? The tool checks whether the intraday price action ever touched the previous close level.
How quickly do gaps of this size typically fill? Broken down by same day, one trading week, 30 trading days, beyond 30 days, or never filled.
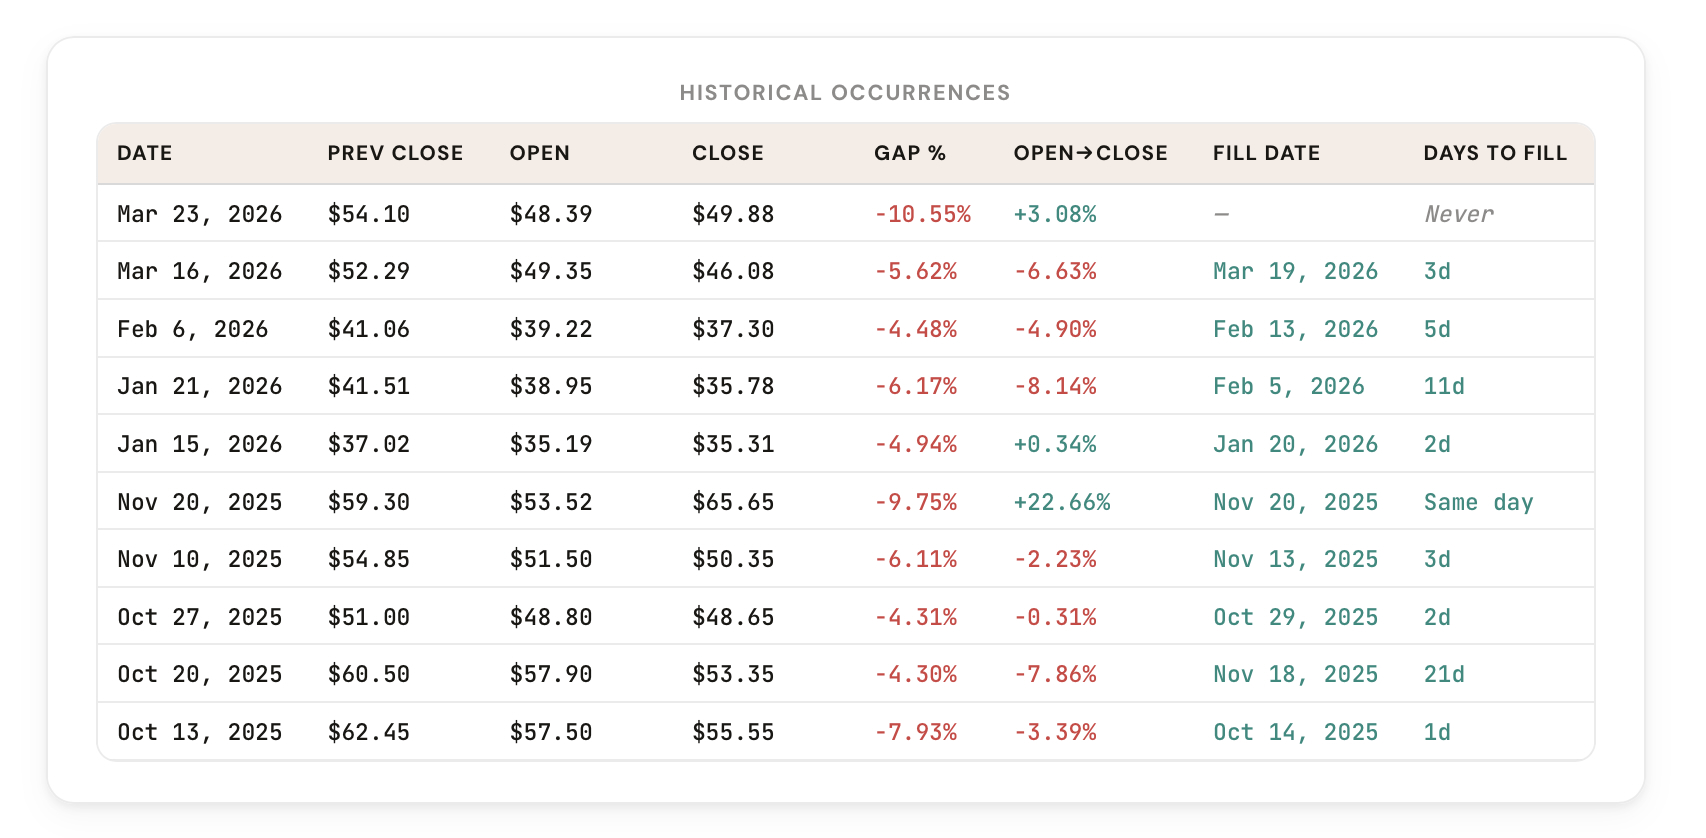
Every matching gap day with previous close, open price, closing price, gap percentage, fill date, and days to fill. Full transparency.
Works with any stock or ETF. Enter a positive percentage for gap-ups, negative for gap-downs, and results appear instantly.
Gaps are among the most psychologically loaded events in trading. They create urgency, trigger stops, and force decisions before most traders have finished their morning coffee. And yet the vast majority of gap-related trading decisions are made with almost no historical context.
Consider what a typical morning looks like without this data. UVXY gaps up 5% at the open. You check social media. Half the replies say "fade it," half say "it's running." You make a decision based on tone, not evidence.
Now consider the alternative. You open the Gap Fill Tool, enter UVXY with a 5% gap-up threshold, and within seconds you know:
Five ways members are already applying the Gap Fill Tool to their process.
Check gap fill probabilities before the open to decide whether to fade, hold, or sit out entirely.
Adjust size based on whether historical data suggests the gap is likely to hold or reverse.
Use fill-timing data to set more informed time-based stops instead of guessing.
Cross-reference gap days with your own strategy entries to see how they overlap.
Study how gap behavior differs across leveraged ETFs versus broad indexes.
The Gap Fill Tool is available in your dashboard under Premium Tools. If you're a CI Volatility member, you already have access.
Open the Gap Fill Tool
Comments
Loading comments…