Trading Tool
April 1, 2026

Based on Today's Stock Market Move, What's Likely to Happen Tomorrow?

Our 1-Day Outlook tool answers this question with real data.

SPY just dropped 1.5% today. AAPL rallied 3% on earnings. TSLA is down 4% for the third session in a row. You're sitting at your desk wondering: based on history, what tends to happen next?

Most traders rely on gut instinct or social media sentiment to answer that question. Someone says "oversold, bouncing tomorrow." Someone else says "this is just getting started." None of it is backed by data.

The real answer is in the historical record. Every stock has thousands of trading days. Many of those days had moves similar to today's. What happened the following session is documented, measurable, and available right now.

The 1-Day Outlook tool was built to surface exactly that data.

How It Works

1-Day Outlook Tool showing next-day forecast for SPY

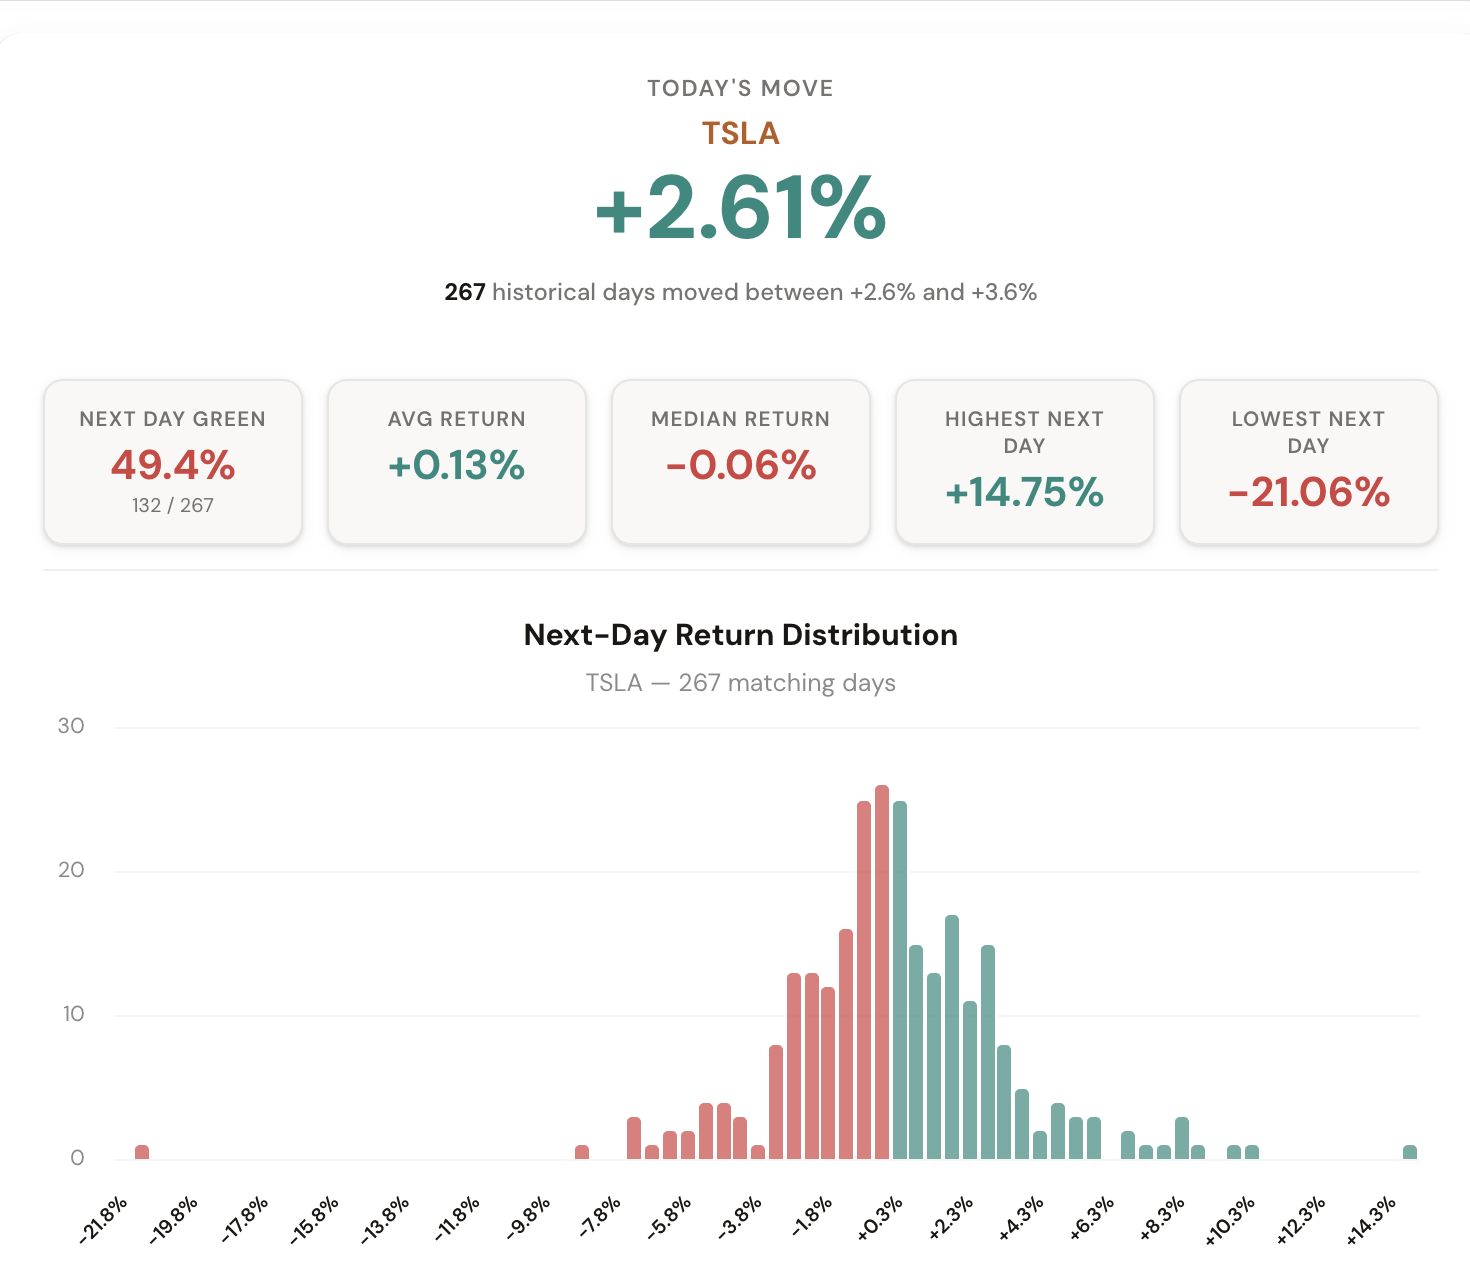
Enter any ticker. The tool automatically detects today's move, finds every historical day with a similar percentage change, and shows you what happened the following session. Distribution charts, directional probabilities, average returns, and a complete breakdown of every matching day.

You control the matching criteria. The tool auto-sets a 1% range from today's move, but you can widen it for more data points or narrow it for precision. The results update instantly.

What the Tool Shows You

A complete statistical picture of what happened next after similar moves.

Next Day

Green or Red?

After a move of this size, what percentage of the time did the stock go up the next day vs. down? The historical directional bias, instantly.

Next Day

Average and Median Return

Did similar days tend to continue, reverse, or stay flat? See both the average and median next-day return for a clearer picture.

Distribution

Return Histogram

A full distribution chart showing where next-day returns clustered. See the range, the skew, and where the majority of outcomes landed.

Filtering

Market Regime Filter

A 2% drop in SPY when the market is calm tells a very different story than the same drop during elevated fear. Filter by VIX regime to isolate the context.

Range

Adjustable Window

The tool auto-sets a 1% range from today's move. Widen it for more data points or narrow it for precision. Full control over the matching criteria.

Coverage

Any Ticker

SPY, QQQ, AAPL, TSLA, AMZN, NVDA, META. Type any ticker and get instant analysis using the full available trading history.

Why Historical Context Changes the Decision

Consider a simple scenario. SPY drops 1.5% today. You're trying to decide whether to buy the dip or wait. Without data, it's a coin flip.

With the 1-Day Outlook, you can check:

That's not a guarantee. It's a base rate. And knowing the base rate before you trade is the difference between guessing and making an informed decision.

How Traders Are Using It

Five ways members are applying the 1-Day Outlook to their equity trading.

1

Buying the dip

SPY dropped 2% today. Check the historical bounce rate for similar drops before deciding whether to add exposure into the close.

2

Post-earnings positioning

AAPL just gapped up 5% on earnings. Does it tend to follow through or fade the next day? The tool shows you the historical pattern.

3

Overnight hold decisions

Your position is up 3% today. Should you hold overnight or take profits? Check whether similar moves historically continued or reversed.

4

Market regime awareness

A 1% SPY drop in a calm market behaves differently than the same drop during a selloff. Filter by VIX regime to see how context changes the odds.

5

Multi-stock comparison

Compare next-day tendencies across SPY, QQQ, and individual names after the same type of move. See which tickers have the strongest historical tendencies.

The Tool Is Live Now

The 1-Day Outlook is available in your dashboard under Premium Tools. If you're a CI Volatility member, you already have access.

Open the 1-Day Outlook

Comments

Loading comments…