New Tool Launch
February 21, 2026

How Much Will Your Leveraged ETF Decay in 30 Days? Now You Can See It

We just launched the Decay Projection tool. Enter a number of days and instantly see projected decay for every leveraged and inverse ETF in the suite.

If you trade leveraged or inverse ETFs, you already know the silent killer: decay. UVXY, SQQQ, SPXU, SOXS, and their peers are designed to lose value over time. The question isn't whether they'll decay. It's how much and how fast.

Most traders have a vague sense that "leveraged ETFs decay," but almost nobody can tell you the actual projected numbers. How much will UVXY lose over the next 30 days if volatility stays flat? What about SQQQ over 60 days? How does SOXS compare to SPXU?

Until now, answering those questions meant building your own models or trusting rough estimates from people who may or may not have done the math.

We built something better.

Introducing the Decay Projection Tool

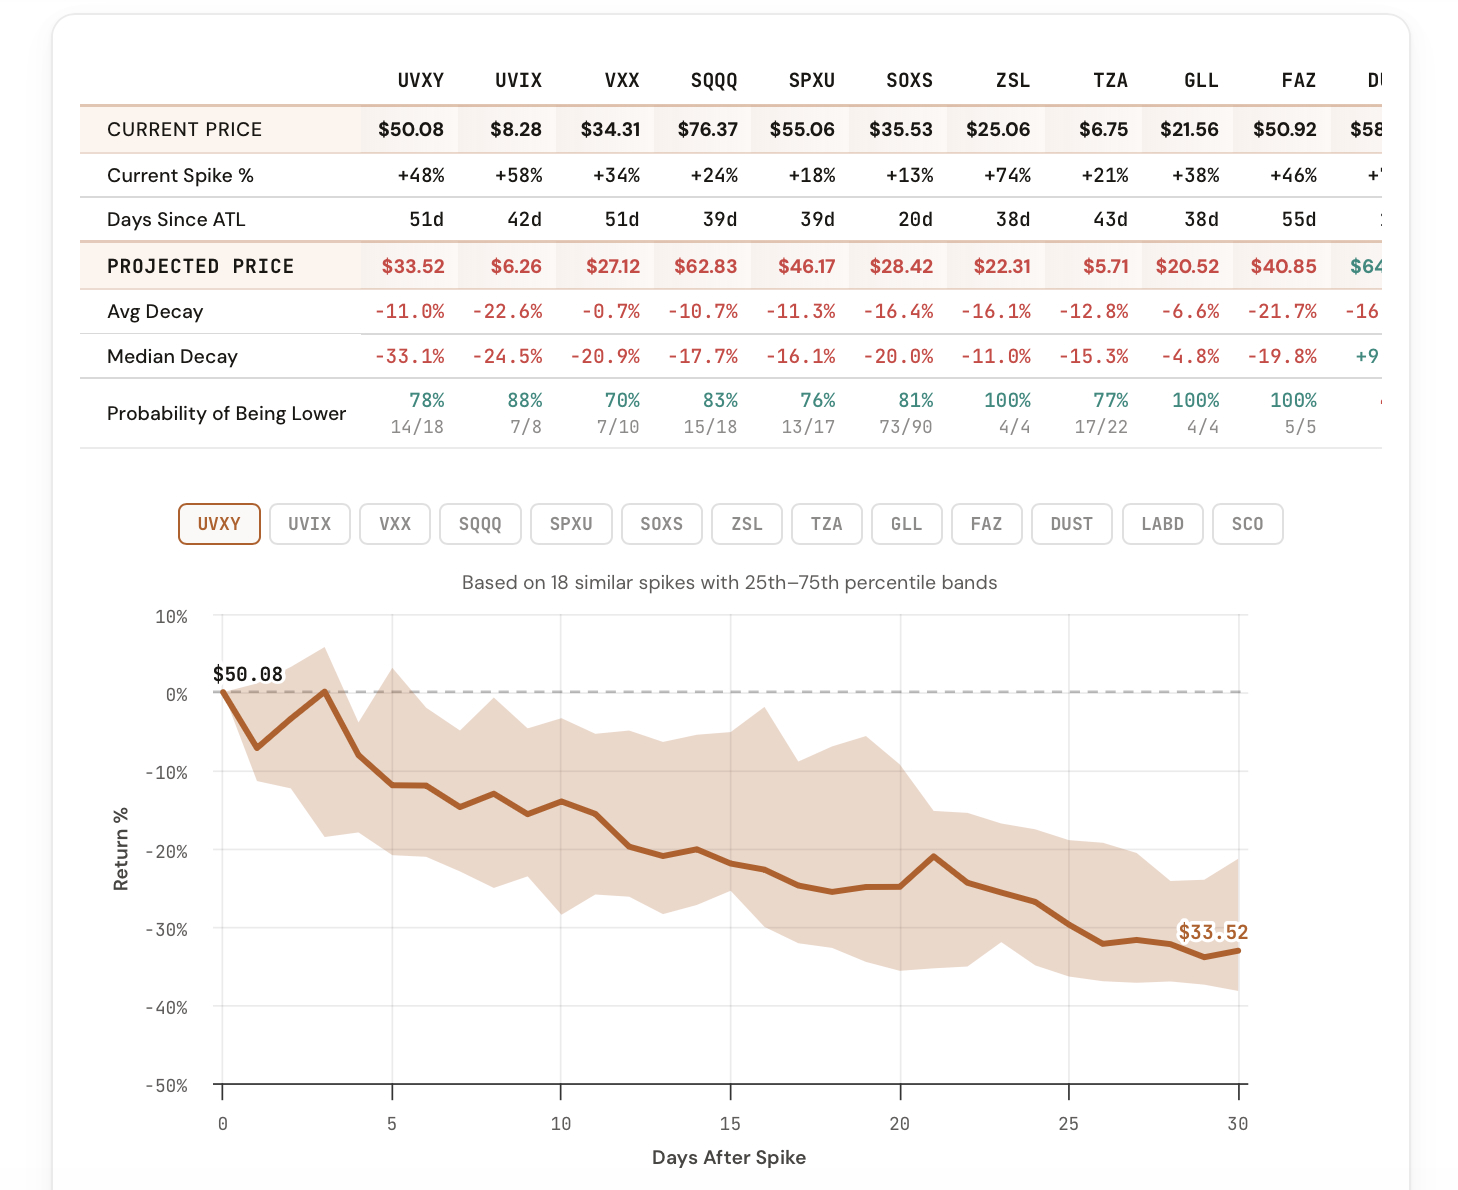
The Decay Projection tool does one thing and does it well: enter a number of days (or a calendar date) and instantly see the projected decay for every leveraged and inverse ETF in the CI Volatility suite, side by side.

Type 30 and you get a complete comparison of how much each ticker is projected to lose over the next 30 trading days based on its historical decay rate. No formulas, no spreadsheets, no guesswork.

No more vague assumptions about decay. Just the numbers.

What the Tool Shows You

A complete cross-ticker decay comparison for any time horizon you choose.

Projection

Projected Decay %

For each ticker, see the projected percentage loss over your chosen time horizon based on historical decay rates. Instantly compare across all ETFs.

Comparison

All Tickers at Once

UVXY, UVIX, VXX, SQQQ, SPXU, SOXS, ZSL, and BOIL shown side by side. See which products decay fastest and which hold up best.

Flexible

Days or Date Input

Enter a number of trading days (30, 60, 90) or pick a specific calendar date. The tool adapts to however you think about your time horizon.

Historical

Based on Real Data

Projections are calculated from actual historical decay rates, not theoretical models. The numbers reflect what actually happened, not what should happen in theory.

Visual

Highlight Extremes

Toggle extreme highlighting to instantly spot the fastest and slowest decayers. See which products are bleeding the most over your chosen window.

Planning

Position Sizing Context

Use projected decay rates to estimate the cost of holding a leveraged position. Know what you're paying in decay before you enter the trade.

How It Works

The Decay Projection tool calculates each ticker's historical rate of value loss over time, driven by the compounding effects of daily rebalancing, contango roll costs, and volatility drag. When you enter a number of days, the tool projects forward from today using those historical rates.

The comparison view gives you:

This is the tool you want open when deciding how long to hold a leveraged position, or when comparing which product gives you the best risk-adjusted exposure for your intended holding period.

How Traders Are Using It

Five ways members are already applying the Decay Projection to their process.

1

Hold-period planning

Before entering a leveraged ETF position, check how much decay you'll pay over your intended hold time.

2

Product selection

Compare decay rates across UVXY, UVIX, VXX, and others to pick the product with the best profile for your trade thesis.

3

Short-side conviction

If you're shorting a leveraged ETF, use projected decay to estimate the tailwind working in your favor over time.

4

Cost-of-carry estimates

Treat projected decay as the cost of holding a leveraged position. Factor it into your P&L expectations before the trade.

5

Client communication

Show concrete decay projections to clients or trading partners who ask "how much will this thing lose if nothing happens?"

The Tool Is Live Now

The Decay Projection tool is available in your dashboard under Premium Tools. If you're a CI Volatility member, you already have access.

Open the Decay Projection Tool

Comments

Loading comments…