Does It Matter Which Day of the Week You Trade Leveraged ETFs?
We just launched Day-of-week return patterns for every leveraged and inverse ETF, backed by years of data.
Is Monday really the worst day to hold UVXY? Is there a midweek pattern that repeats? Do Fridays behave differently because of weekend risk? These are questions every active trader has wondered about but few have actually tested.
Day-of-week effects have been studied in academic finance for decades, but almost always for broad market indexes. When it comes to leveraged and inverse ETFs, the research barely exists. And the products behave differently enough from the S&P 500 that broad market findings don't necessarily apply.
Until now, getting day-of-week return data for these specific products meant downloading the full price history and running the calculations yourself, for every ticker, for every weekday.
We built something better.
Introducing the Weekday Patterns Tool
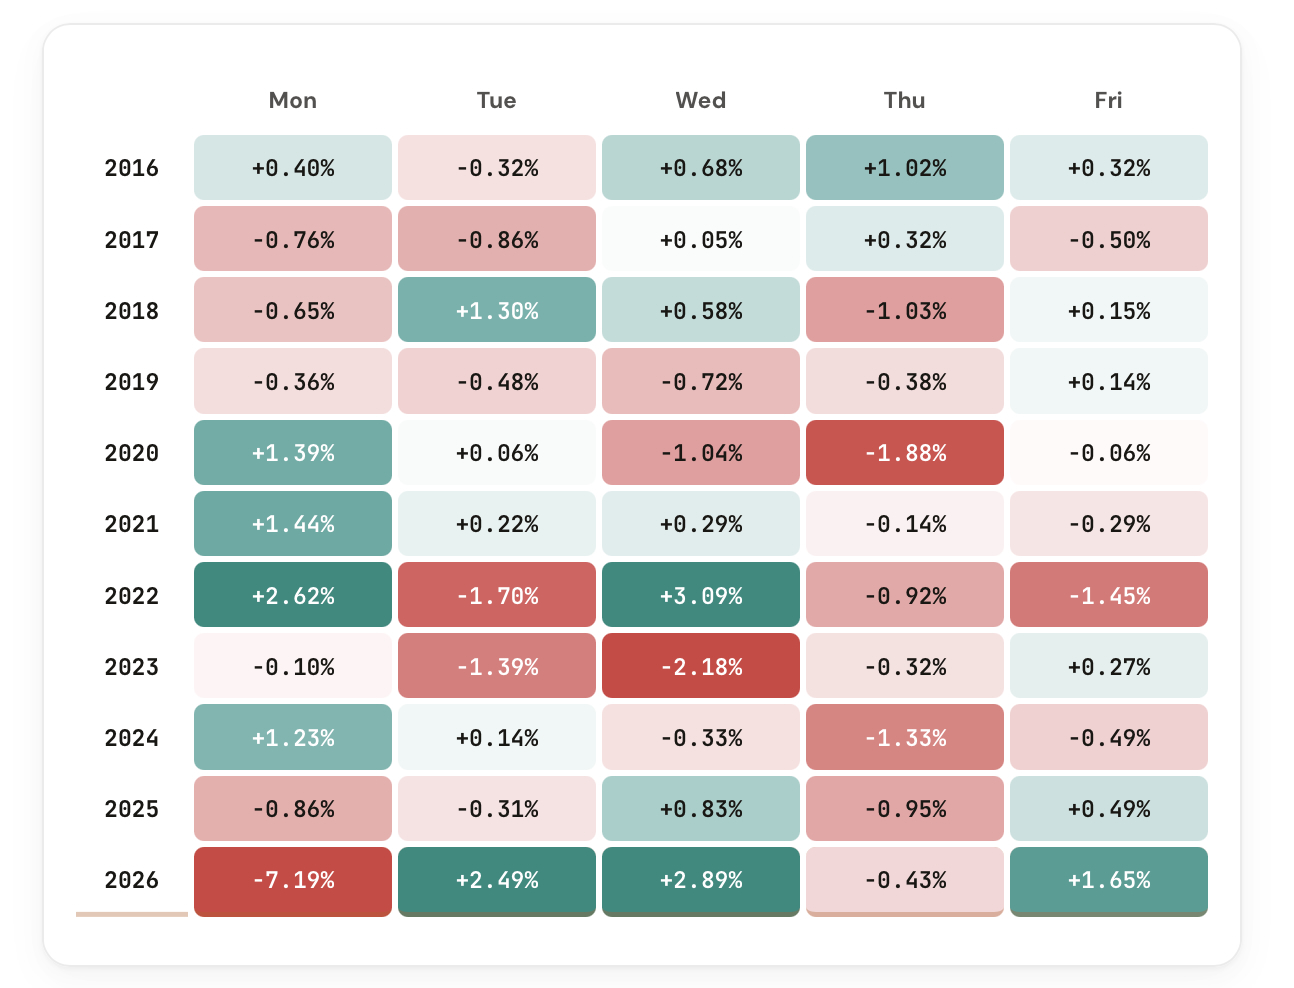
The Weekday Patterns tool shows the median and average daily return for each day of the week, Monday through Friday, for every ticker in the CI Volatility suite. Pick a ticker and instantly see whether certain days consistently perform better or worse than others.
Select UVXY and you see which weekday historically delivered the steepest losses and whether any day offered a relative reprieve.
No more hunches about "Monday weakness" or "Friday reversals." Just the data.
What the Tool Shows You
Complete day-of-week return breakdowns for every ticker in the suite.
Daily
Median & Average Returns
See the median and average daily return for Monday, Tuesday, Wednesday, Thursday, and Friday. Toggle between the two for different perspectives.
Visual
Bar Chart Summary
A clean bar chart showing all five weekdays at a glance. Instantly spot which days are consistently positive, negative, or neutral.
Detail
Full Data Table
Switch to Detail view for the complete statistical breakdown: sample size, standard deviation, and individual data points behind each weekday average.
Coverage
7 Built-in Tickers + Custom
UVXY, UVIX, VXX, SQQQ, SPXU, SOXS, ZSL built in, plus a custom ticker option for any symbol you want to analyze.
Modes
Summary or Detail View
Summary gives you the quick visual read. Detail gives you the full dataset behind each bar so you can assess consistency and outliers.
Comparison
Cross-Ticker Patterns
Flip between tickers to see whether weekday effects are consistent across products or unique to specific leveraged ETFs.
How It Works
The tool calculates the daily return for each ticker on every trading day in its history, then groups those returns by weekday. For each day (Monday through Friday), it computes the median return, the average return, and the full distribution.
This is the tool you want when deciding whether to enter, exit, or hold over a specific day. If Wednesdays historically see the steepest declines for your ticker, that's actionable context.
How Traders Are Using It
Five ways members are already applying the Weekday Patterns tool to their process.
1
Day-specific entries
Time entries for the weekday with the strongest historical tailwind for your intended direction.
2
Overnight hold decisions
Check whether holding overnight into a historically weak day is worth the risk, or if closing before is the better play.
3
Weekly planning
At the start of each week, review which days historically favor your positions and plan your activity accordingly.
4
Strategy filtering
Layer weekday patterns on top of other signals. Only take trades when the day-of-week effect aligns with your setup.
The Tool Is Live Now
The Weekday Patterns tool is available in your dashboard under Premium Tools. If you're a CI Volatility member, you already have access.
Comments
Loading comments…